As we head into the third quarter of 2024, we have compiled five charts that we think highlight some of the key themes and opportunities we see in the current market environment. Please feel free to contact us if you would like to discuss these themes further or learn more about how we could help you meet your investment objectives.
1. Sticky Inflation Leads to Lower Rate Cut Expectations
Major central banks began cutting rates modestly in Q2, with the Bank of Canada and the European Central Bank both cutting by 25bps. In contrast, the U.S. Fed held at its current level to avoid potentially reigniting inflation concerns.
The stickier inflation picture has led markets to price in a meager 2-3 cuts in 2024, down from the 6-7 cuts expected at the beginning of the year. Rates may remain higher for longer throughout the second half of 2024 and into 2025 if inflation remains above 2%. Although this would limit the interest rate contribution to traditional fixed income returns, active credit managers tend to be better positioned to navigate this environment through dynamic credit selection and relative value opportunities.
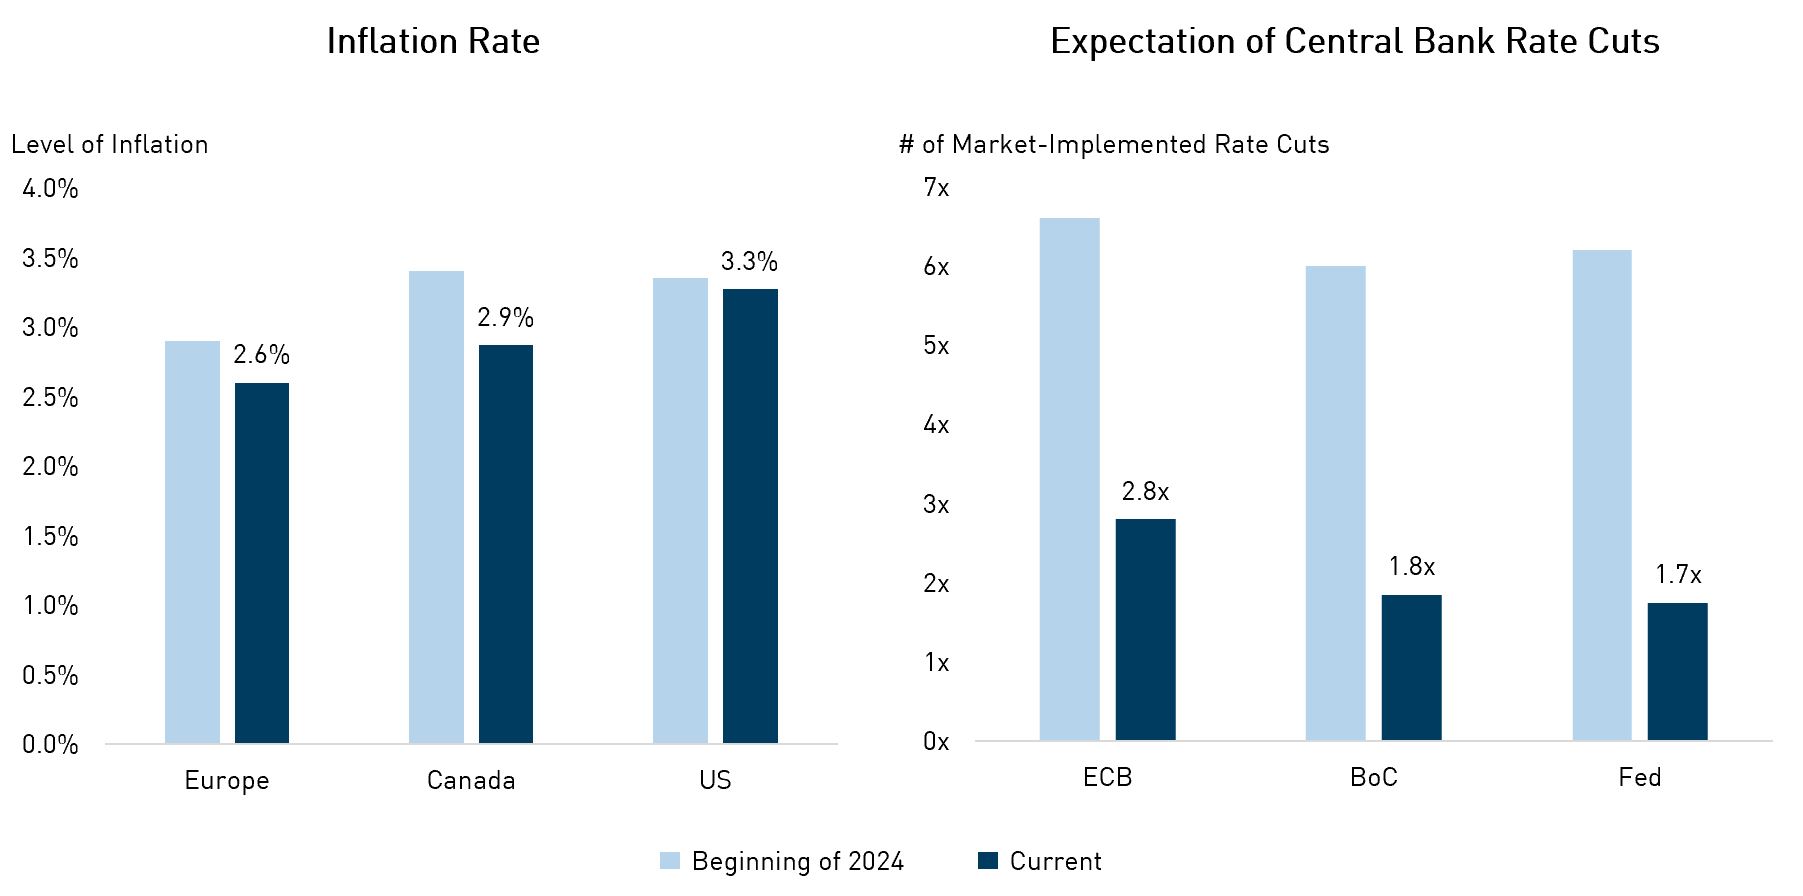
Source: YCharts. Bloomberg. Central bank rate cuts data as of June 28, 2024. Inflation data as of May 31, 2024.
2. Public Firms are Better Positioned for a Higher Rate Environment Than Private Firms
As a “higher for longer” environment persists, public debt looks favourable to private credit and private loans. For example, interest coverage (i.e., how easily a company can service its debt) is notably better for public companies relative to private firms. The average public company’s ratio stands at 4.3x, more than double that of private firms. This gap has widened in the past 5 years as interest rates have begun to bite borrowers.
Many public companies took advantage of lower interest rates after the pandemic and refinanced at a lower cost to strengthen their balance sheets. This, combined with the recent strength in earnings and revenue, resulted in improved financial health. In contrast, private credit issuers have, on average, experienced a smaller earnings recovery and tend to have less diversified revenue streams.
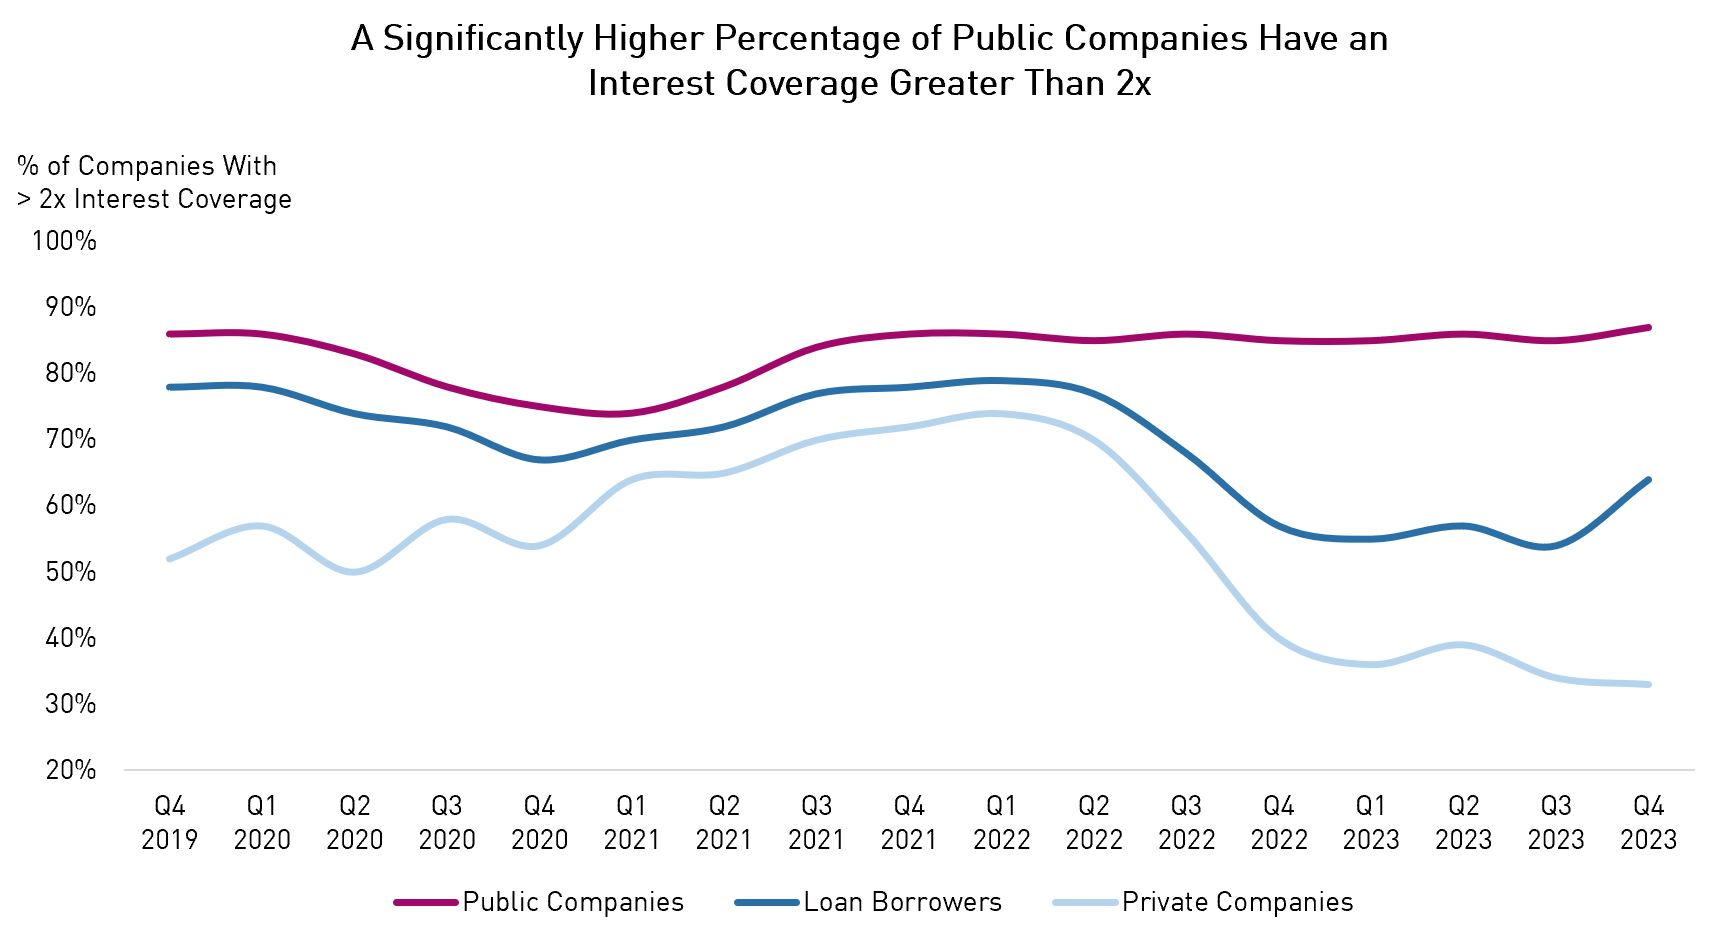
Source: JP Morgan, CapitalIQ. Interest Coverage based on LTM EBITDA/Net Interest Expense. Data as of December 31, 2023.
3. Risk of Low-Quality Bonds Not Worth the Reward
Credit spreads of BB-rated bonds – the least risky section of the high-yield market – have rallied this year, supported by resilient growth and robust demand. However, spreads in even riskier pockets of the credit market, like CCC-rated bonds, have not fared as well. Lower-quality issuers tend to carry more leverage and are more cyclical in nature, making them vulnerable to higher borrowing costs and potential defaults.
The graph below illustrates how the CCC-rated segment of the market notably repriced higher relative to the BB-rated segment. Investors now demand greater compensation for buying these lower quality bonds, and while they also offer higher yields, we believe a higher-quality bias is warranted to avoid potential landmines in this uncertain environment. Valuations remain high relative to historical standards.
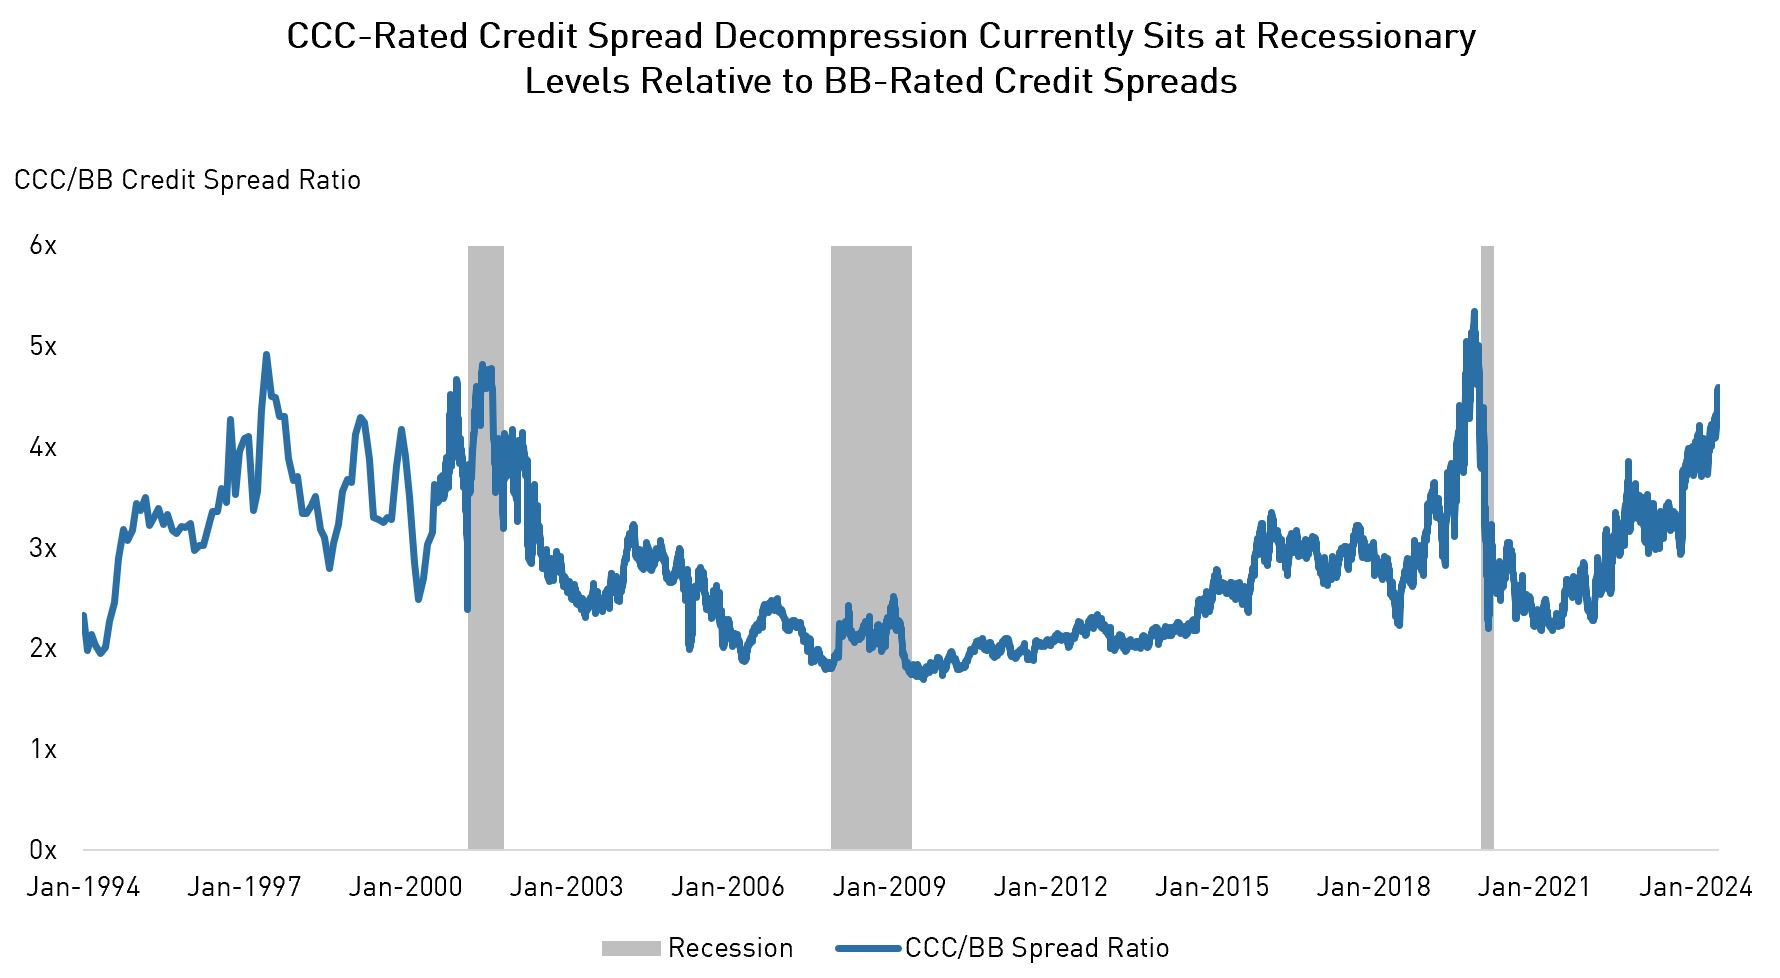
Source: Bloomberg, NBER. Data as of July 2, 2024.
4. Persisting High Levels of Bond Issuance May Not Lead to Lower Prices
Total bond issuance across Investment Grade and High Yield markets ended the quarter with the second-largest year-to-date supply in history. New issuance has been high as firms try to precede their upcoming maturity walls and fortify their balance sheets to prepare for an uncertain U.S. election and other risky geo-political scenarios.
To counteract this high supply of credit, demand has been equally robust and contributed to muted volatility in credit spreads during the year. This provides comfort that future supply can also be absorbed well as record cash levels are redeployed from money market instruments and into corporate fixed income in H2 2024. Additionally, increasing coupon payments and redemptions are expected to push net issuance into the negative territory for both IG and HY and could present a positive technical for credit spreads in the coming quarters.
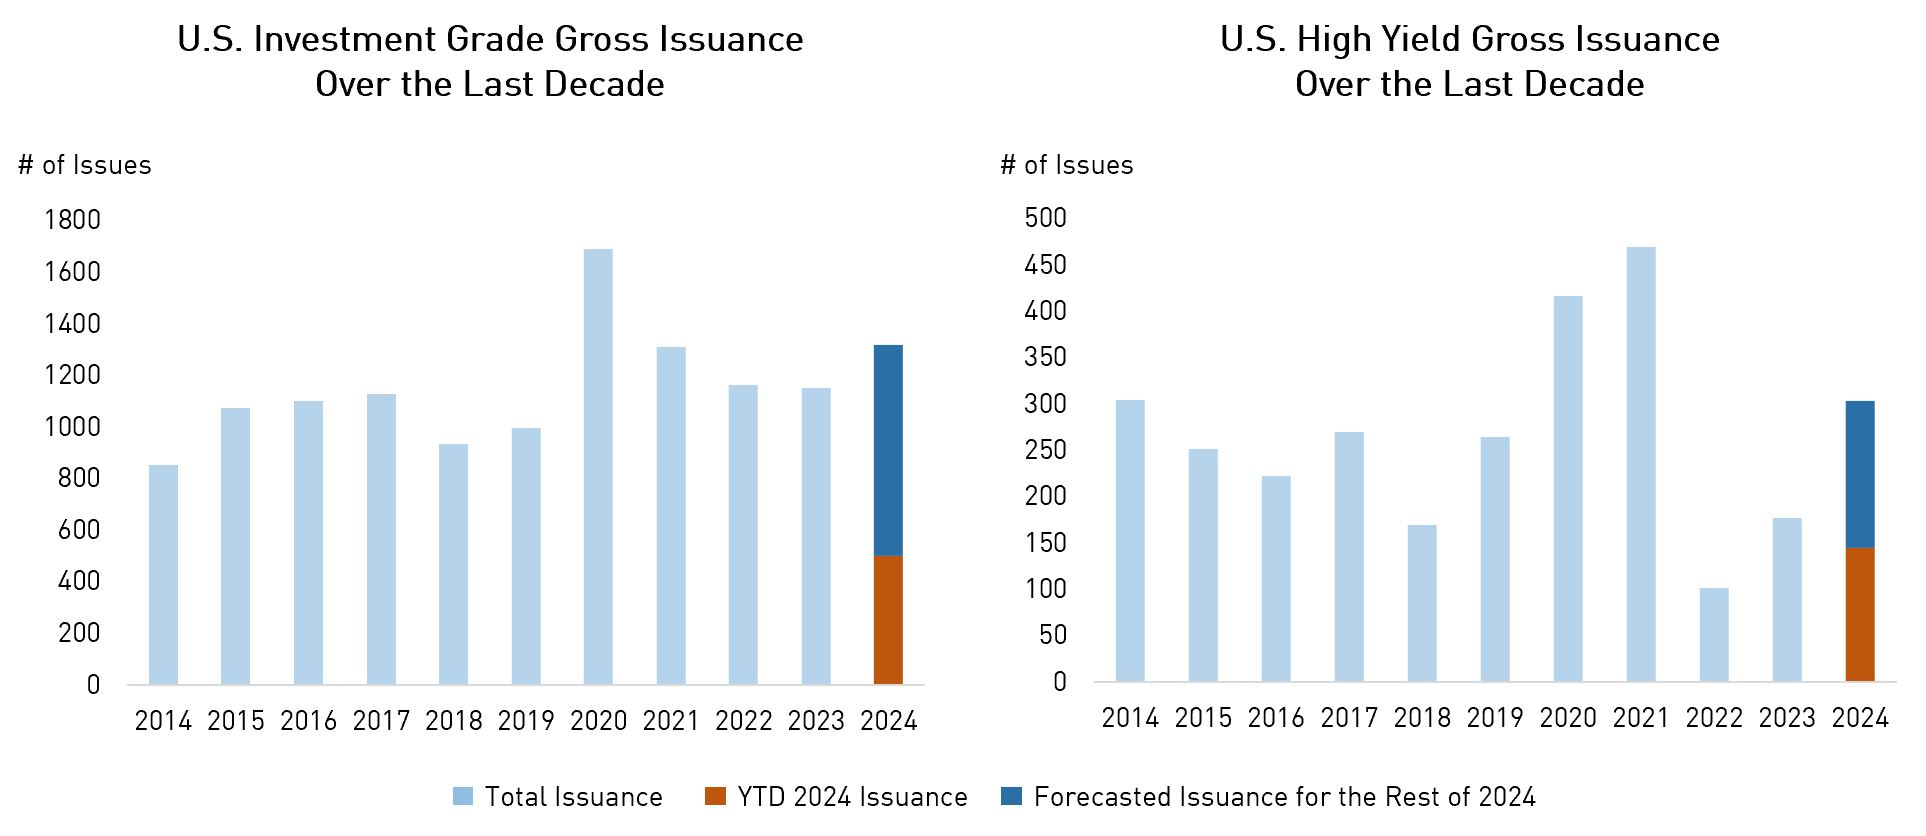
Source: BarclaysLive. Data as of June 30, 2024.
5. Active Credit Managers Can Deliver Higher Alpha Than Equities
Our recent analysis highlighted how active fixed income can better deliver long-term alpha compared to equity strategies. The data revealed that, on average, fixed income strategies outperform the U.S. aggregate bond market by 60 basis points on an annualized basis. In contrast, equity managers have been underperforming the broader equity market for most of the past decade, and especially today as stocks continue to perform well.
Although equity beta can provide sufficient returns in the short-term, the inherent inefficiencies of the credit market create numerous opportunities to generate additional value, making active credit managers a more advantageous choice for long-term alpha generation.
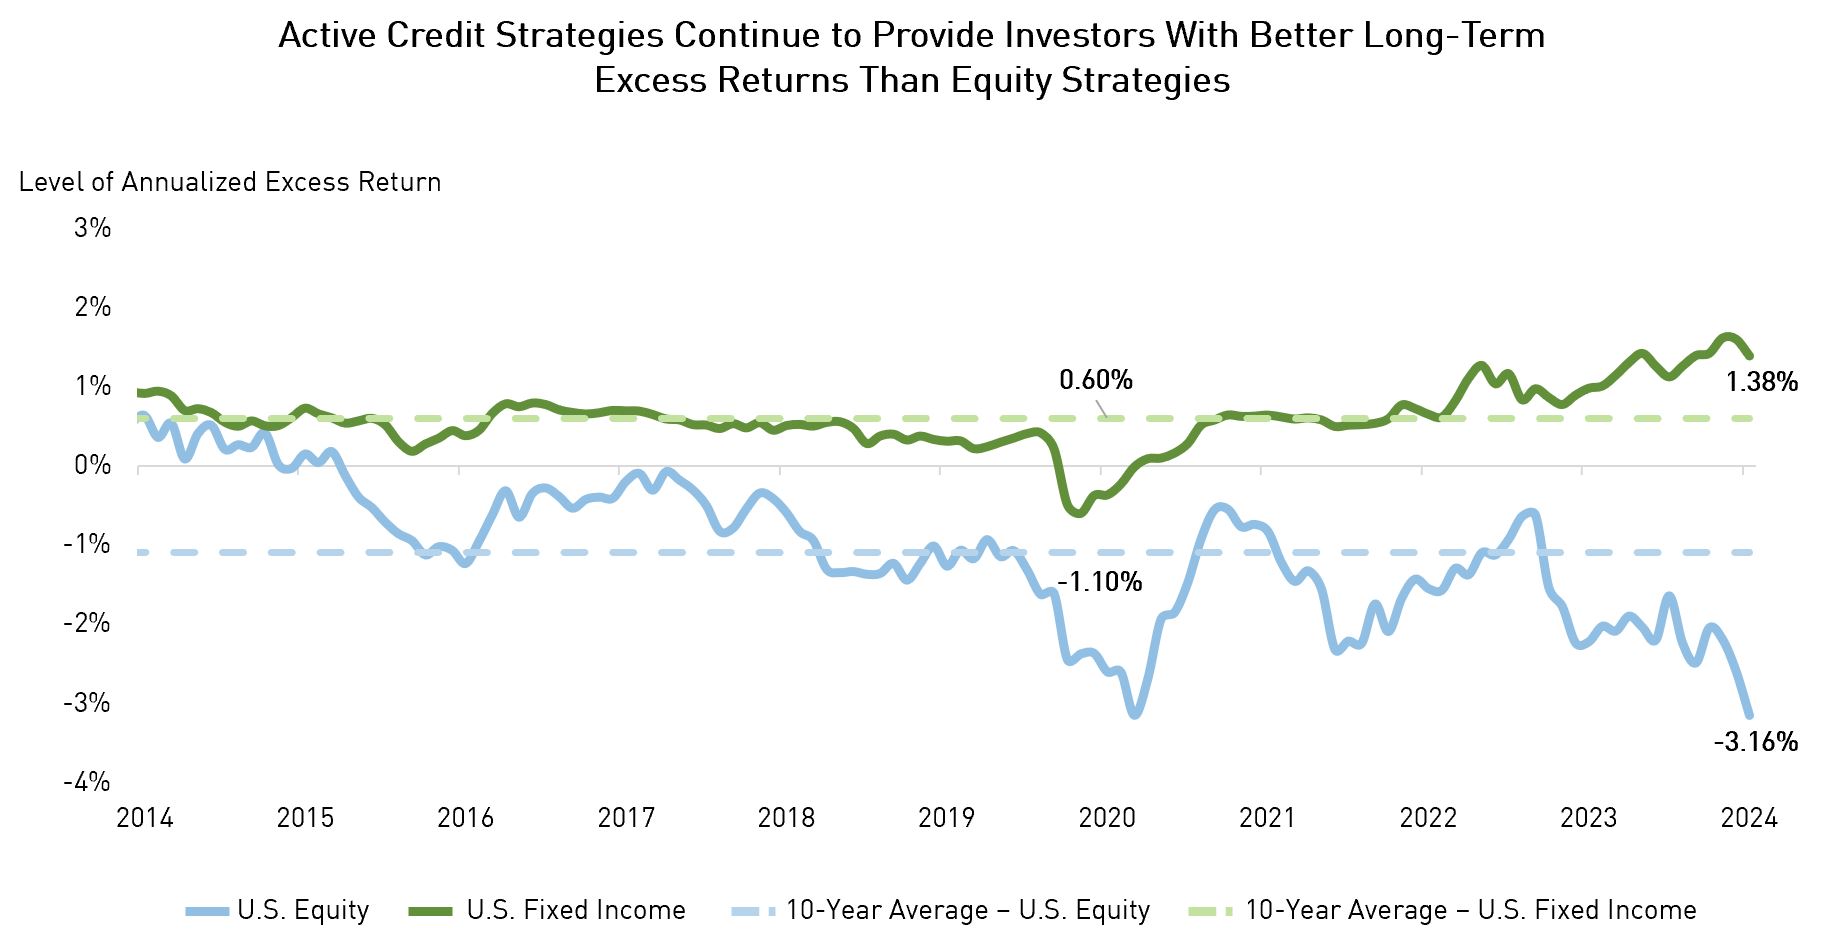
Source: Source: eVestment. Data as of June 30, 2024, US Equity annualized excess return = median performance of All US Equity strategy universe (~3600 strategies) vs. S&P 1500 Index (the index covers 90% of US market capitalization). US Fixed Income annualized excess return = median performance of All US Fixed Income strategy (~2700 strategies) vs. US Aggregate Bond Index. 5-year rolling basis.
Important Information
The information herein is presented by RP Investment Advisors LP (“RPIA”) and is for informational purposes only. It does not provide financial, legal, accounting, tax, investment, or other advice and should not be acted or relied upon in that regard without seeking the appropriate professional advice. The information is drawn from sources believed to be reliable, but the accuracy or completeness of the information is not guaranteed, nor in providing it does RPIA assume any responsibility or liability whatsoever. The information provided may be subject to change and RPIA does not undertake any obligation to communicate revisions or updates to the information presented. Unless otherwise stated, the source for all information is RPIA. The information presented does not form the basis of any offer or solicitation for the purchase or sale of securities. Products and services of RPIA are only available in jurisdictions where they may be lawfully offered and to investors who qualify under applicable regulation. RPIA managed strategies and funds carry the risk of financial loss. Performance is not guaranteed and past performance may not be repeated.
Commissions, trailing commissions, management fees and expenses all may be associated with mutual fund investments. Please read the prospectus before investing. Indicated rates of return include changes in share or unit value and reinvestment of all dividends or distributions and do not take into account sales, redemption, distribution or optional charges or income taxes payable by any securityholder that would have reduced returns. Returns for time periods of more than one year are historical annual compounded total returns while returns for time periods of one year or less are cumulative figures and are not annualized. Mutual funds are not guaranteed, their values change frequently and past performance may not be repeated. The compound growth chart is used only to illustrate the effects of a compound growth rate and is not intended to reflect future values or returns of the Fund.
The index performance comparisons presented are intended to illustrate the historical performance of the indicated strategies compared with that of the specified market index over the indicated period. The comparison is for illustrative purposes only and does not imply future performance. There are various differences between an index and an investment strategy or fund that could affect the performance and risk characteristics of each. Market indices are not directly investable and index performance does not account for fees, expense and taxes that might be applicable to an investment strategy or fund. “Forward-Looking” statements are based on assumptions made by RPIA regarding its opinion and investment strategies in certain market conditions and are subject to a number of mitigating factors. Economic and market conditions may change, which may materially impact actual future events and as a result RPIA’s views, the success of RPIA’s intended strategies as well as its actual course of conduct.