The third quarter ushered in a broad-based selloff as central bank projections of a higher-for-longer interest rate environment, fiscal deficit concerns, and unfavorable supply-demand dynamics reignited interest rate volatility. While this may make fixed income investors weary of what's to come, in a series of charts, we highlight why we believe high-quality credit is more attractive than it has been in a long time.
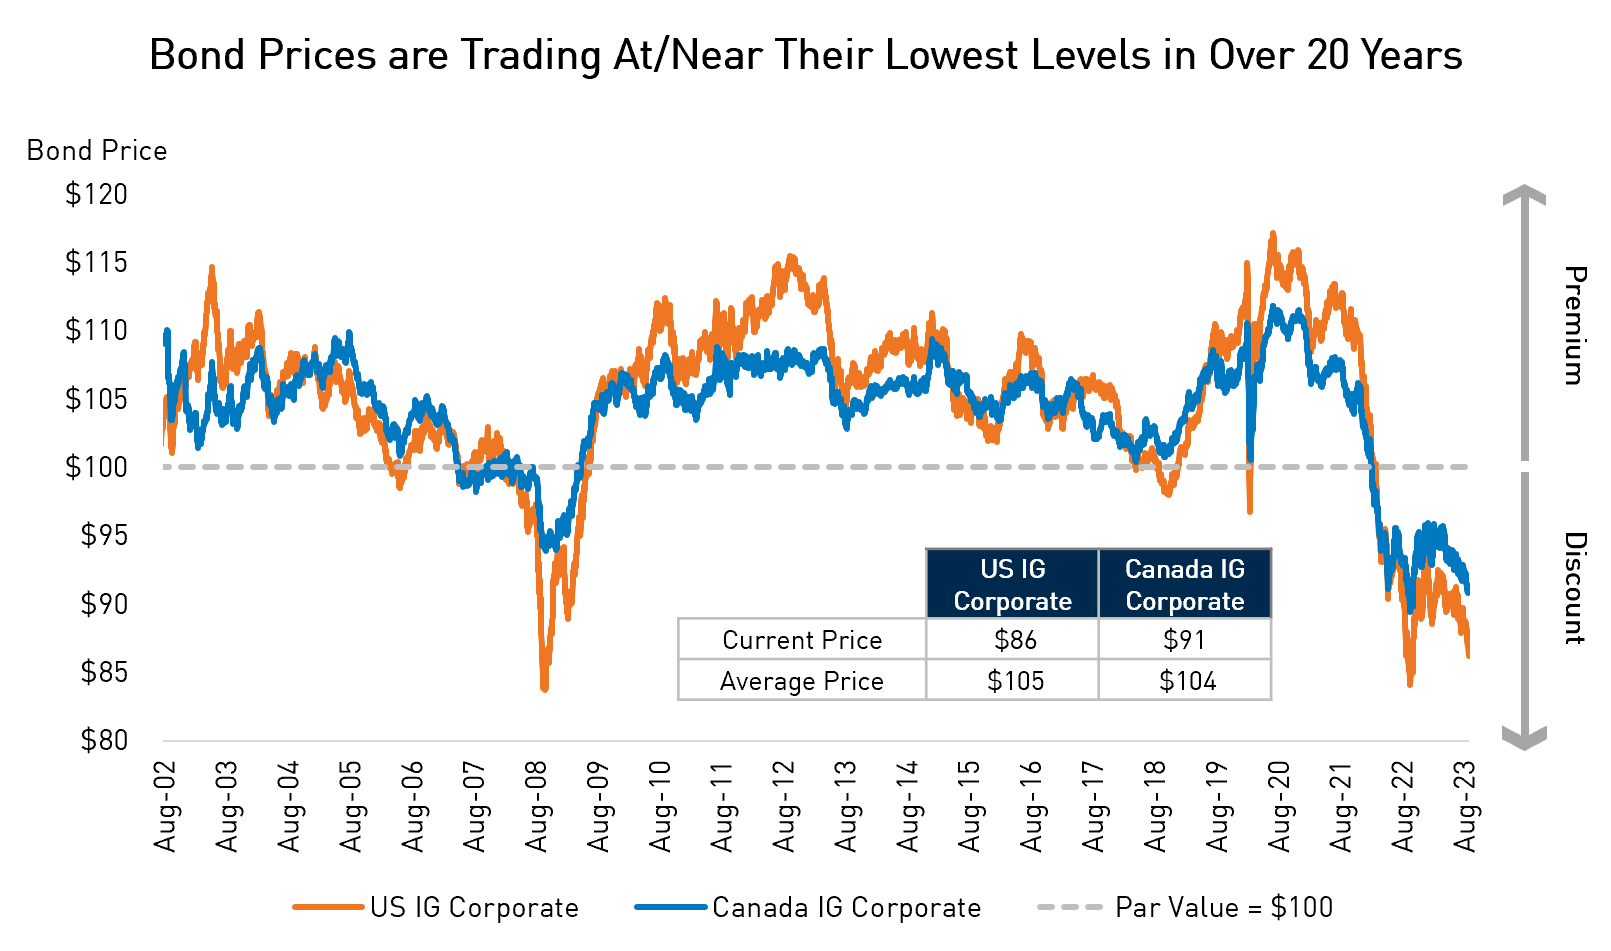
1. Investment Grade Bonds are Trading at an Incredible Discount
Investment grade corporate bonds are trading at price discounts representing 20-year lows. This market dynamic allows investors to participate in very attractive tax-efficient returns through capital gains when these resilient bonds pull back to their $100 par value.
 Source: Bloomberg, ICE BofA. Data as of October 3, 2023. Investment Grade Index Yield = ICE BofA US Corporate Master Effective Yield, S&P Earnings Yield = S&P 500 Forward Earnings Yield.
2. Maximizing After-Tax Yield Can Lead to Surprisingly High Returns
GIC returns are sourced 100% from coupon payments, which are taxed in non-registered accounts at the investor’s full marginal tax rate. In comparison, total returns for bonds include coupon payments as well as capital gains, which are taxed at only 50% of the investor’s marginal tax rate. This makes after-tax bond returns far more tax-efficient when they are trading at discounts to par value – like we are seeing in the current environment.
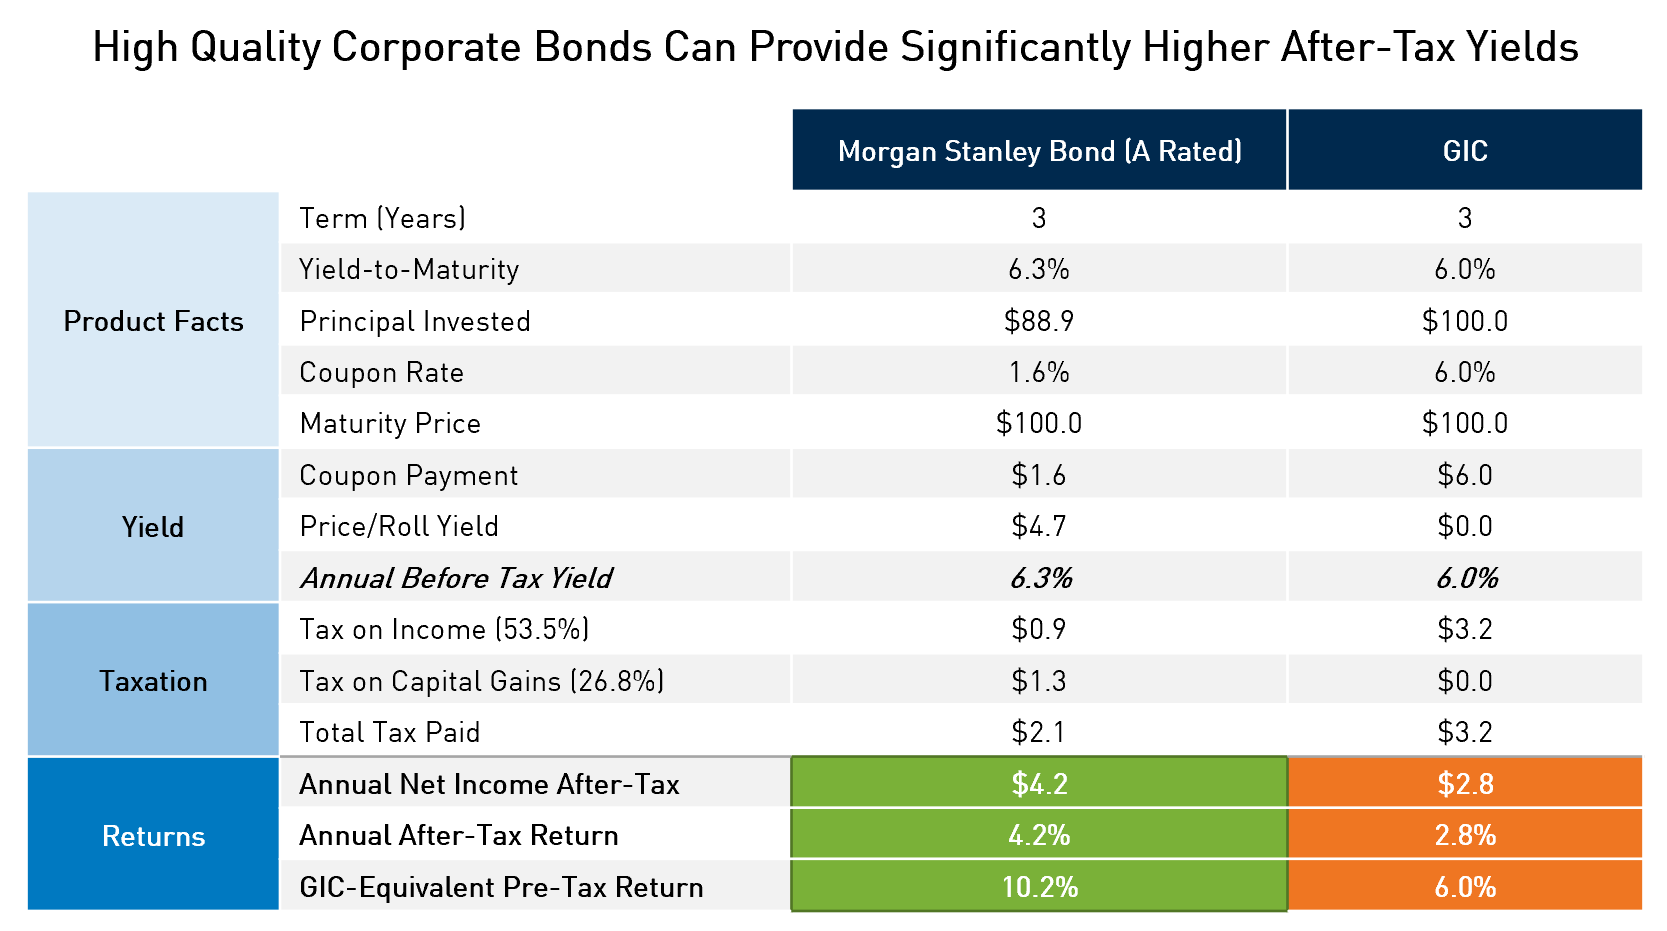
Source: RPIA, Bloomberg, RBC. Data as of October 2, 2023. Morgan Stanley Bond = MS 1.593 05/04/2026 05/04/2027 USD SENIOR_UNSECURED. GIC = Highest 2-3Yr GIC rate rounded to the nearest whole percentage offered by Canadian banks. GIC-Equivalent Pre-Tax Return = the equivalent yield of the bond if it were taxed as 100% income compared to its current yield-to-maturity breakdown between coupon and capital gain, which would result in the same after-tax yield under both calculation methodologies.
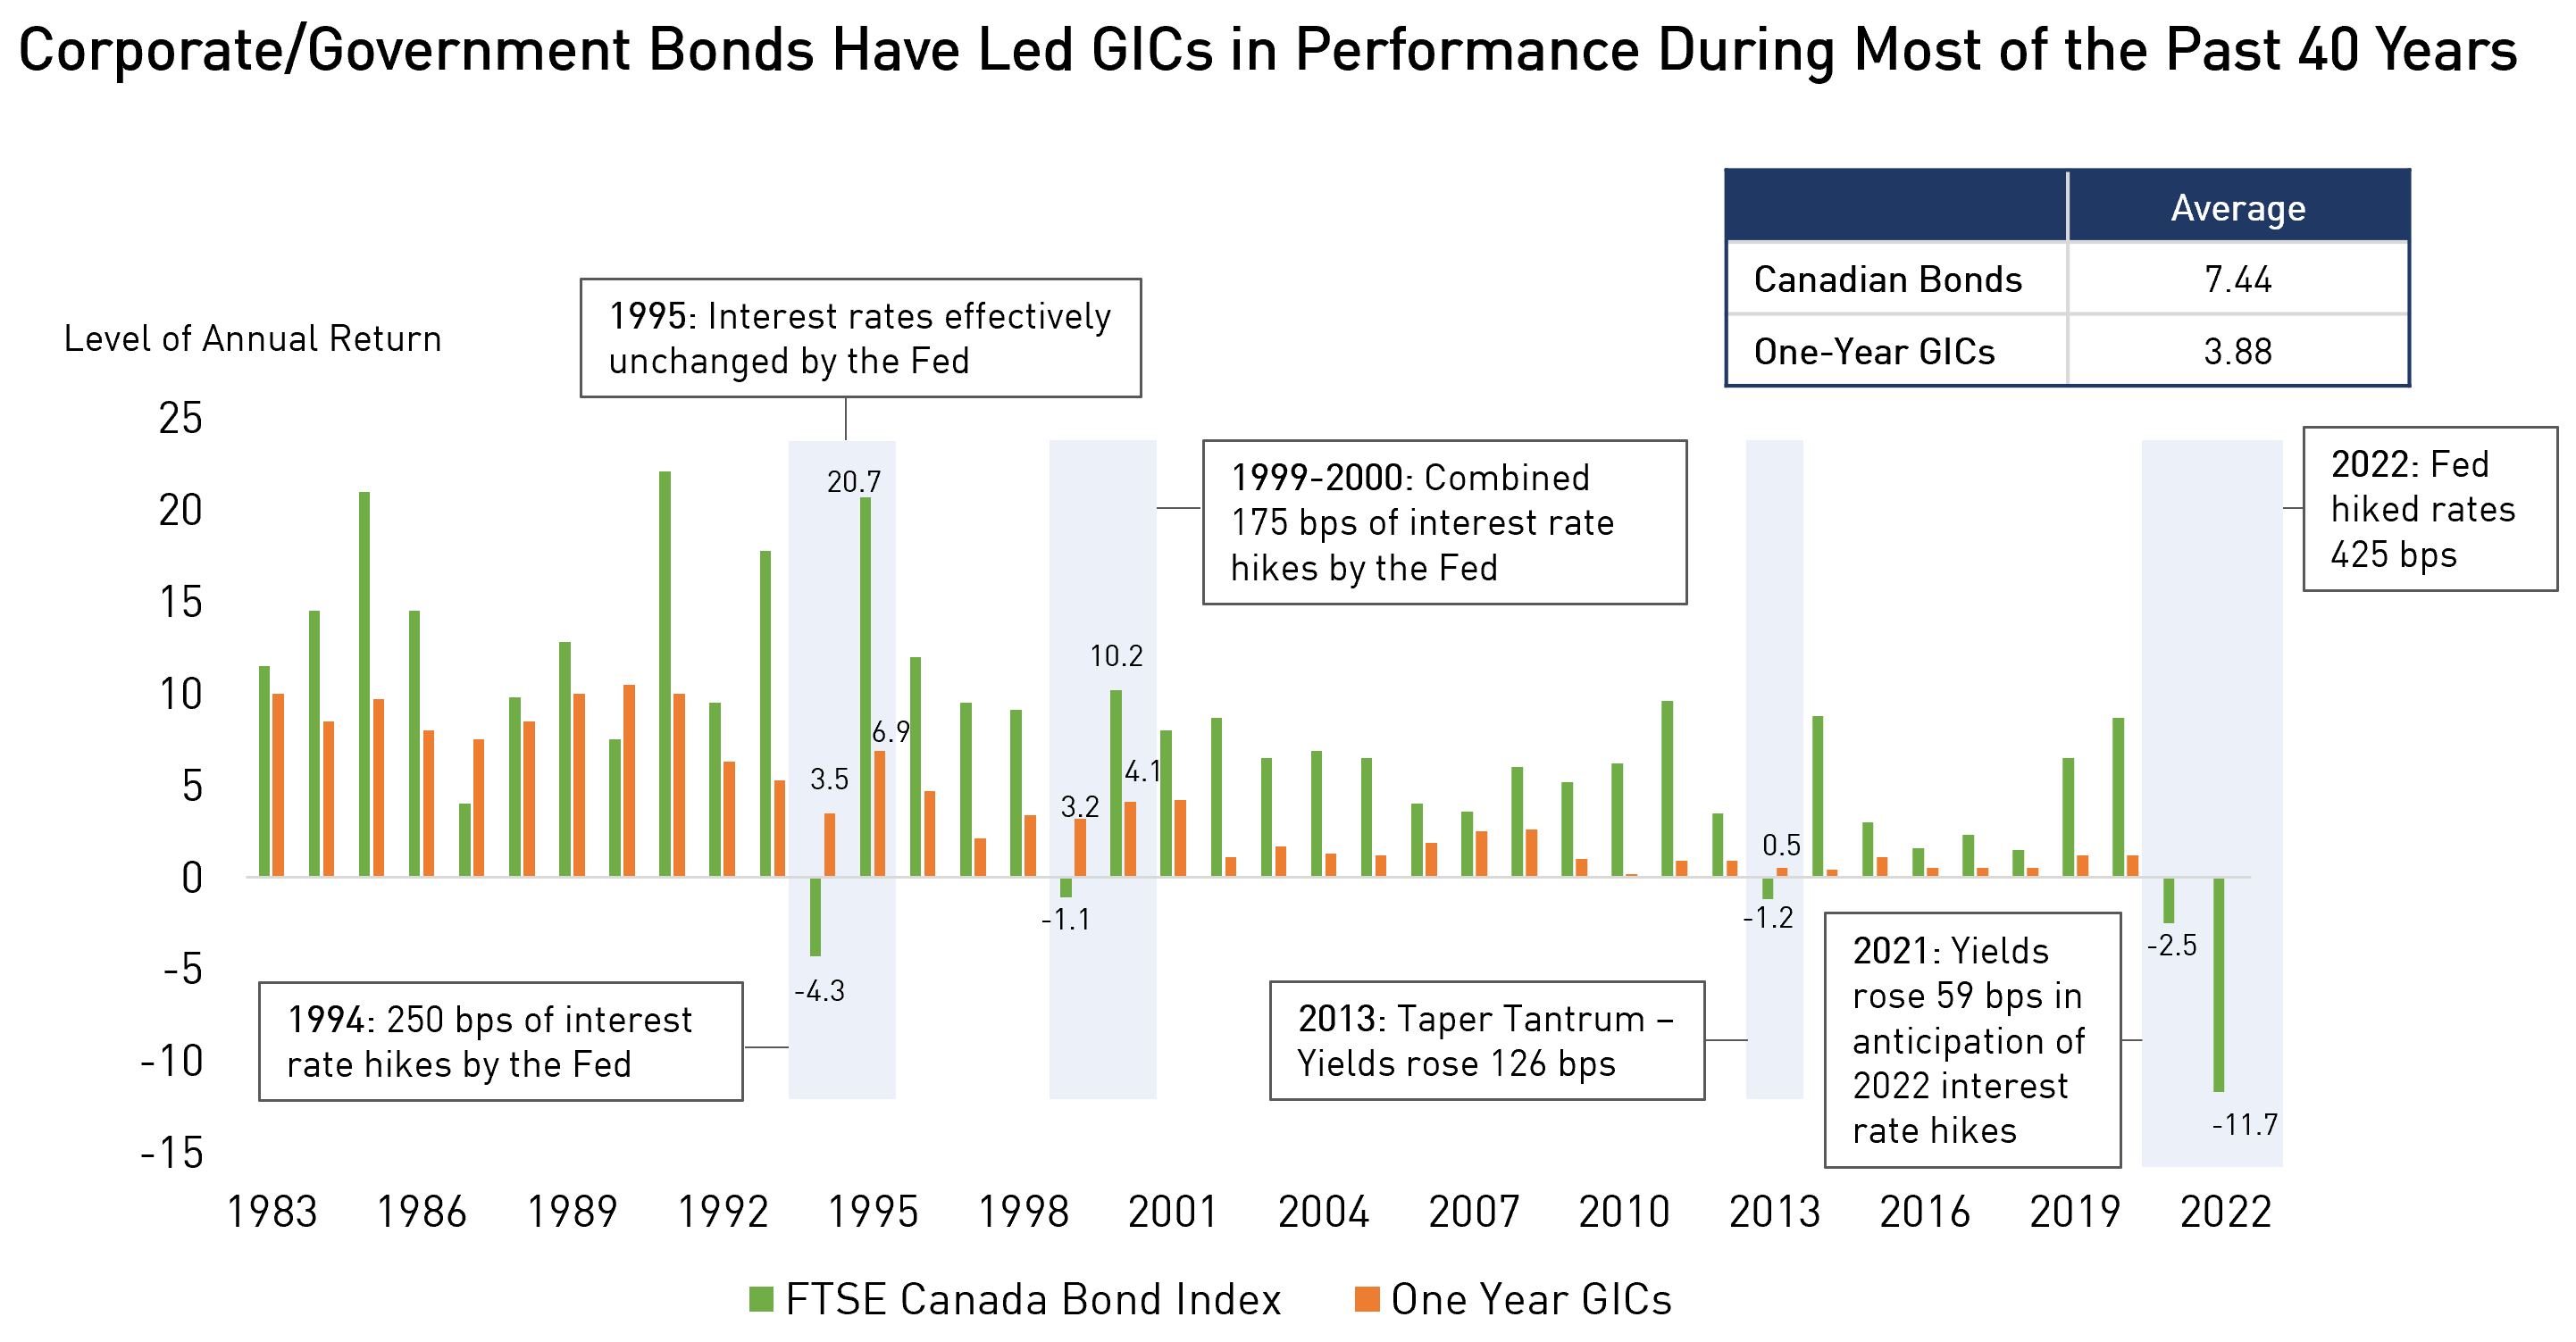
3. The End of a Hiking Cycle May Be the Worst Time to Choose a GIC Over Bonds
Over the past 40 years, bond returns have exceeded those of one-year GICs in 33 out of 40 years; in other words, 83% of the time.
Historical data demonstrates that following periods of interest rate hikes that led to losses, bond returns have experienced a significant recovery in subsequent years – most notably in 1995, 2000, and 2014, when the FTSE Canada Universe Bond Index generated more than twice the return as one-year GICs.
 Source: FTSE, Fidelity. Data as of December 31, 2022. One-year GICs performance is estimated using the GIC rate offered by major banks in the previous year-end.
4. Bonds Provided Significant Protection During Previous Market Downturns
Bonds have acted as an important ballast for portfolios during periods of market stress. A weak economy often leads to a “flight to safety” response and a sudden decline in bond yields, which leads to significant bond returns.
At current yield levels of ~6%, we believe bonds offer an exceedingly attractive opportunity and can be a material return diversifier and enhancer if equity markets deteriorate faster than expected.
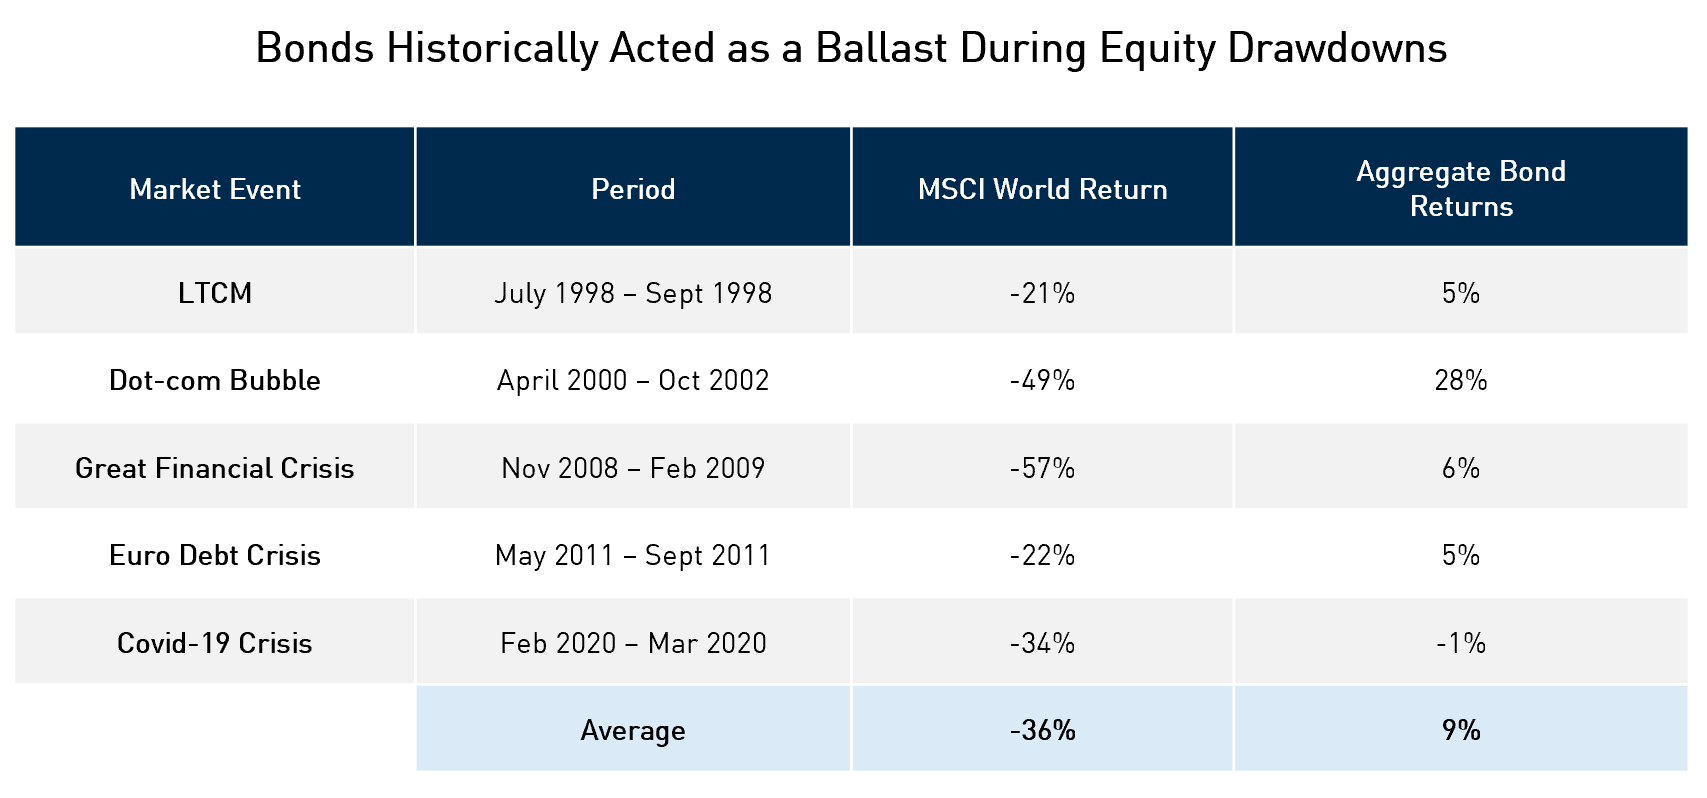
Source: Bloomberg, MSCI, GMO. Data as of October 2, 2023. MSCI World Return = Total Return of the MSCI World (USD), Aggregate Bond Returns = Bloomberg US Aggregate. LTCM = 07/20/98 – 10/05/98, Dot-com Bubble = 03/27/00 – 10/09/02, GFC = 10/31/07 – 03/09/09, Euro Crisis = 05/02/11 – 10/04/11, Covid-19 Crisis = 02/19/20 – 03/23/20.
5. Investors Can Generate Better Yields from Securities Higher in the Capital Structure
Equity valuations remain potentially lofty and are beginning to feel the adverse effects of rising real rates, whereas all-in yields on investment grade bonds are attractive in both absolute and relative terms. This environment makes the case for greater fixed income exposure as a compliment to equities or cash in a portfolio as they sit higher on a company’s capital structure.
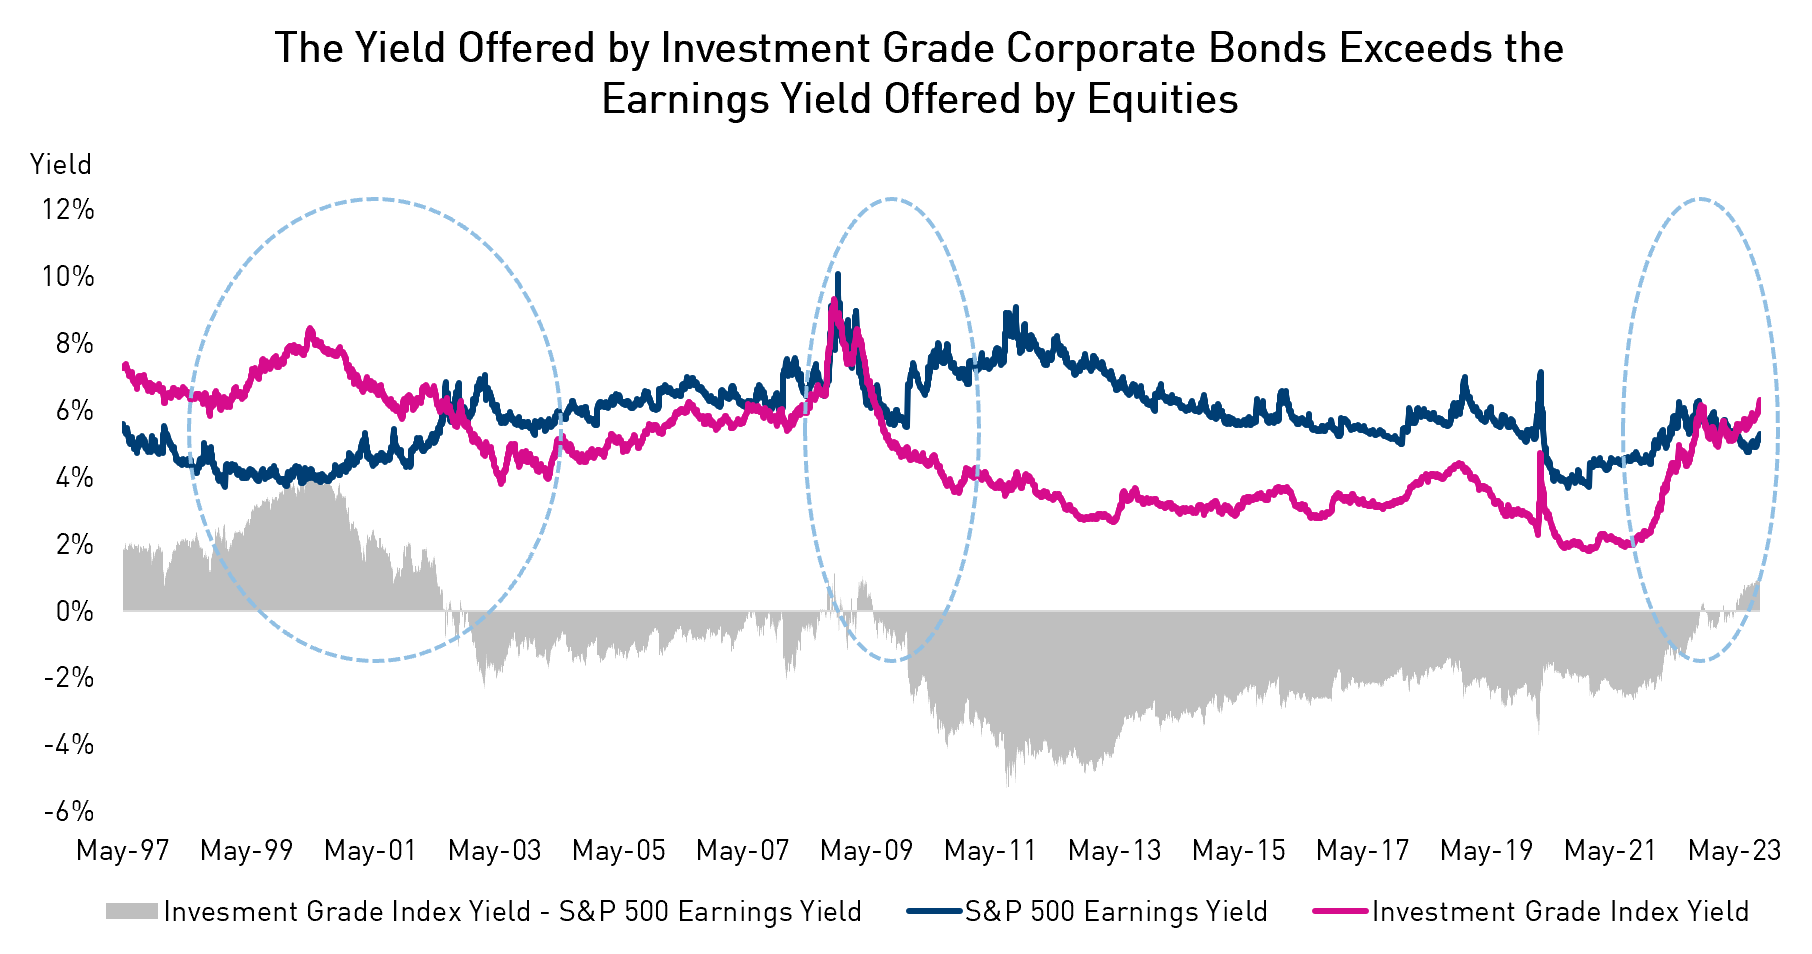 Source: Bloomberg, ICE BofA. Data as of October 3, 2023. Investment Grade Index Yield = ICE BofA US Corporate Master Effective Yield, S&P Earnings Yield = S&P 500 Forward Earnings Yield.
Important Information
The information herein presented by RP Investment Advisors LP (“RPIA”) is considered confidential and is presented for informational purposes only. It is for use by the indicated recipient only and is not intended for investor or public distribution. The holder of this document will use a reasonable degree of care to protect the information to prevent unauthorized use, dissemination, or publication of any of the content. The information does not provide financial, legal, accounting, tax, investment, or other advice and should not be acted or relied upon in that regard without seeking the appropriate professional advice. The information is drawn from sources believed to be reliable, but the accuracy or completeness of the information is not guaranteed, nor in providing it does RPIA assume any responsibility or liability whatsoever. The information provided may be subject to change and RPIA does not undertake any obligation to communicate revisions or updates to the information presented. Unless otherwise stated, the source for all information is RPIA. The information presented does not form the basis of any offer or solicitation for the purchase or sale of securities. Products and services of RPIA are only available in jurisdictions where they may be lawfully offered and to investors who qualify under applicable regulation. RPIA managed strategies and funds carry the risk of financial loss. Performance is not guaranteed and past performance may not be repeated.
The index performance comparisons presented are intended to illustrate the historical performance of the indicated strategies compared with that of the specified market index over the indicated period. The comparison is for illustrative purposes only and does not imply future performance. There are various differences between an index and an investment strategy or fund that could affect the performance and risk characteristics of each. Market indices are not directly investable and index performance does not account for fees, expense and taxes that might be applicable to an investment strategy or fund.
“Forward-Looking” statements are based on assumptions made by RPIA regarding its opinion and investment strategies in certain market conditions and are subject to a number of mitigating factors. Economic and market conditions may change, which may materially impact actual future events and as a result RPIA’s views, the success of RPIA’s intended strategies as well as its actual course of conduct.