As we head into the final quarter of 2024, we have compiled five charts that we think highlight some of the key themes and opportunities we see in the current market environment. Please feel free to contact us if you would like to discuss these themes further or learn more about how we could help you meet your investment objectives.
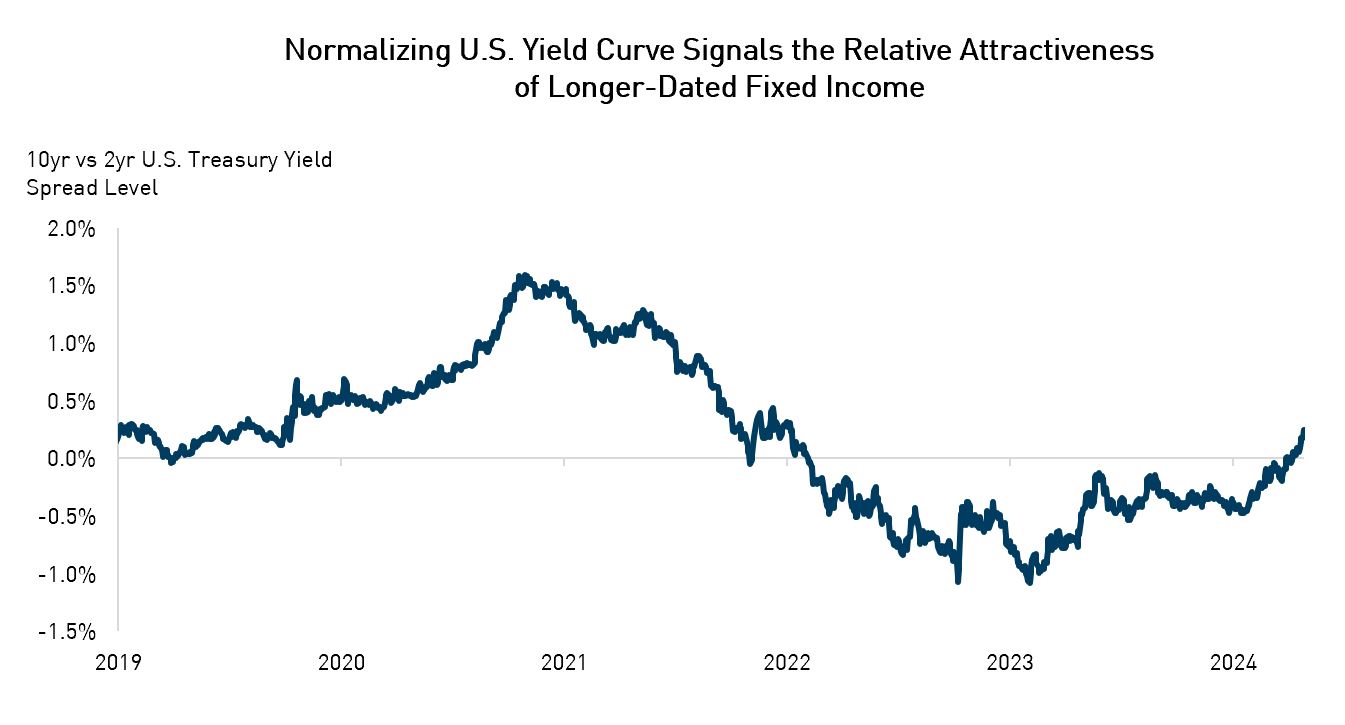
1. The U.S. Yield Curve is Starting to Normalize
For almost 800 days, the U.S. 10yr bond yield was lower than the U.S. 2yr bond yield, the longest period of inversion on record. Now that administered rates have begun to fall, the yield curve is starting to normalize to its typical upward slope.
This decline in short-dated yields also represents a loosening of financial conditions following the tightening that occurred last year. As the relative attractiveness of longer-term fixed income improves, we expect investors to redeploy capital into longer-dated fixed income securities.
Source: Bloomberg. Data as of September 25, 2024.
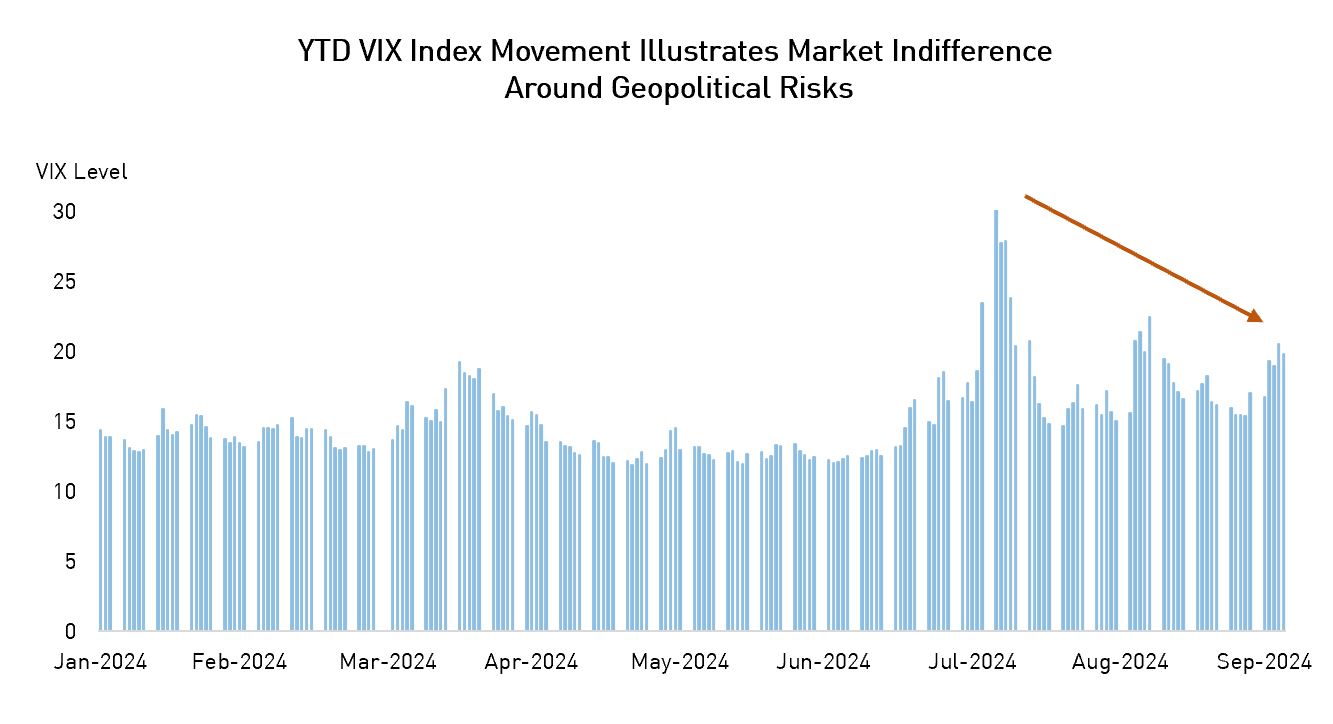
2. VIX Marginally Higher on the Year, Suggesting the Potential Underpricing of Geopolitical Risk Ahead
The VIX index, which shows the market’s expectations of 30-day liquidity, spiked in August but has since settled down to the 10-15 range. We believe the market is underpricing geopolitical and political risk given the ongoing conflicts in the Middle East and Ukraine and the approaching U.S. election. This may partly be corrected once the market turns its attention to the U.S. presidential election, but caution is warranted should any geopolitical risks come to a head in the coming months.
Source: CapitalIQ. Data as of October 4, 2024.
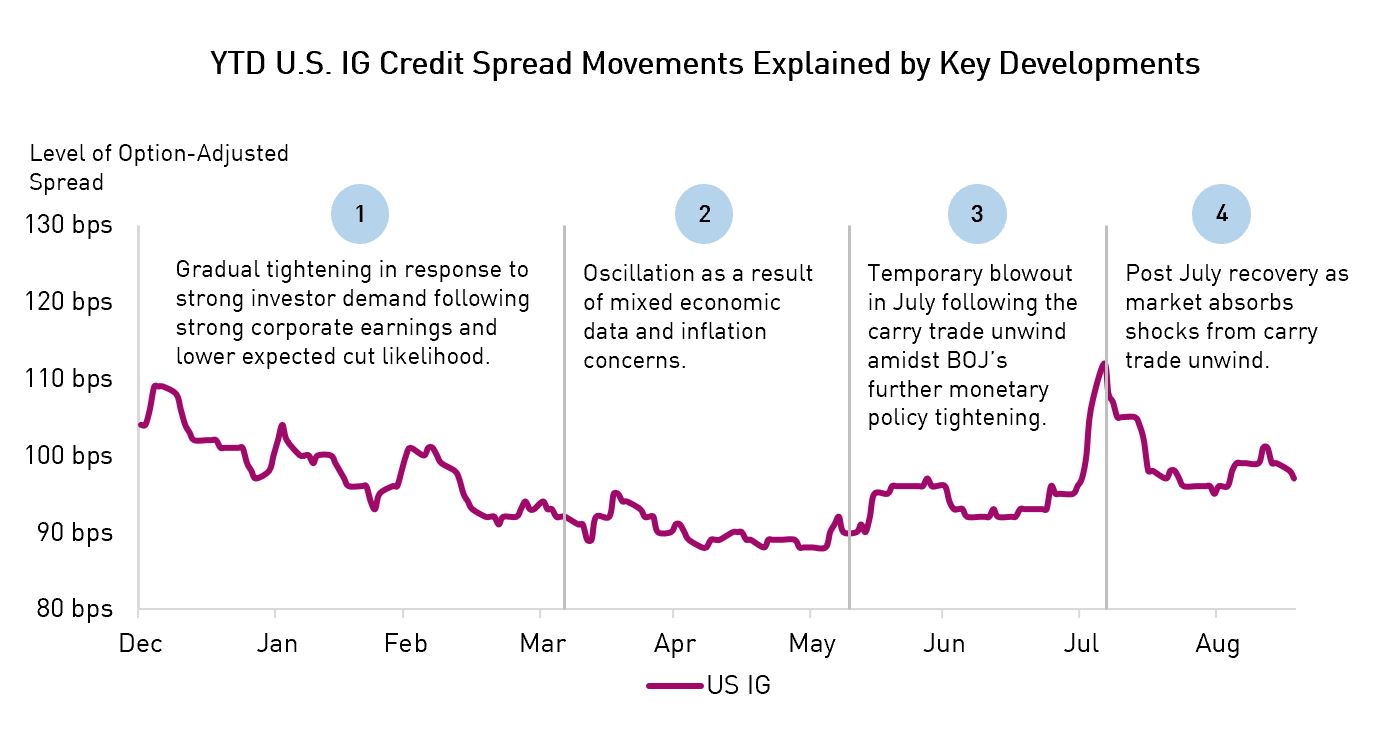
3. Credit Spreads Have Tightened a Bit this Year with Some Variability Along the Way
The U.S. credit market can be divided into four distinct periods based on its year-to-date movements:
- January-March: Interest rate cuts are taken out of the market, but robust demand for corporate bonds persists, supported by a favorable market backdrop.
- March-May: Credit spreads remain rangebound as inflation and economic concerns continue to weigh on investor sentiment.
- May-July: Spreads widen over the summer, driven primarily by the Bank of Japan’s rate hikes.
- July-September: The market recovers as strong fund flows push spreads tighter, reflecting continued investor interest.
Source: FRED. Data as of September 24, 2024.
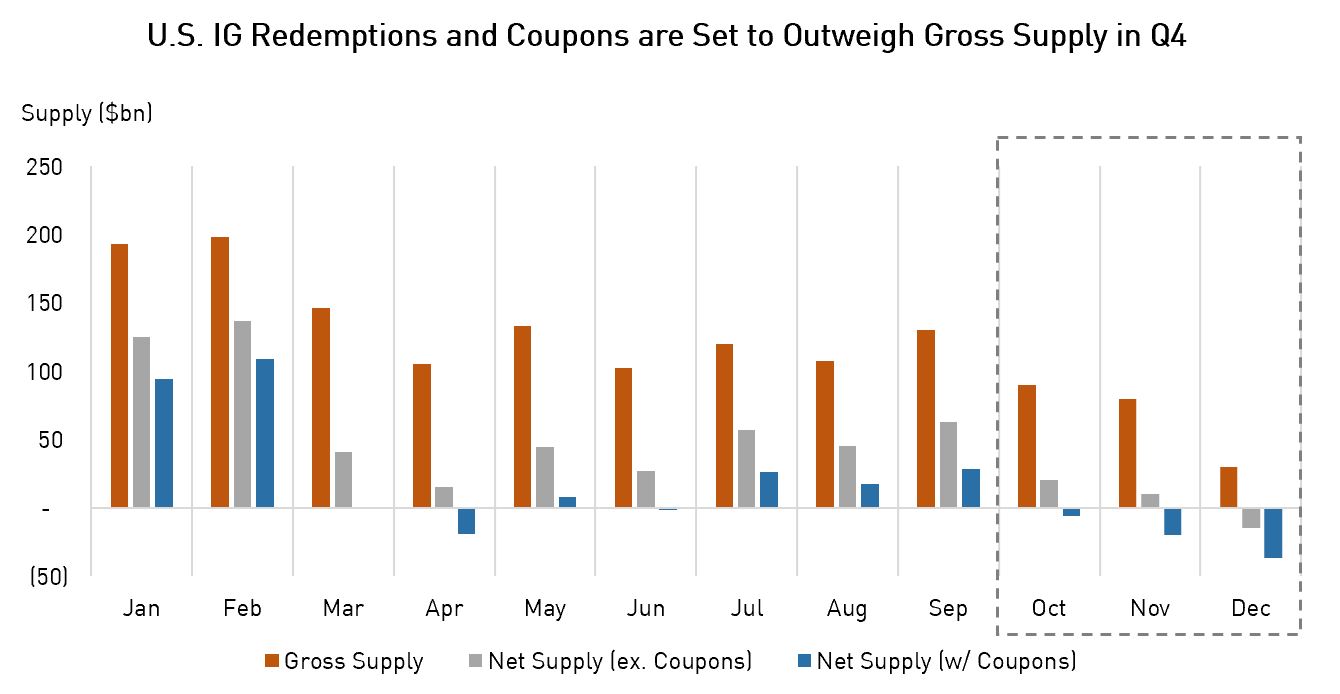
4. Q4 Supply Tapering Expected to Act as a Tailwind for Credit Spreads
Year-to-date, the investment grade market has seen a lot of issuance, but strong demand has easily absorbed the supply, pushing credit spreads to historically tight levels.
Looking ahead, net credit supply – factoring in bond maturities and coupon payments – is expected to turn negative in Q4 2024, which could be another positive catalyst for credit spreads. However, this may be complicated by some risk from the U.S. political sphere.
Source: BofA Global Research, TD Securities. Data as of August 31, 2024.
5. A Sharp Increase in Large $1bn+ Portfolio Trades, Likely Driven by Fully Funded Pension Plans
As the funded status of U.S. pension plans has increased, many plans seek to increase their hedge ratio and “lock in” funded status gains, typically by extending duration in their corporate bond portfolios.
One manifestation of this is the sharp increase in the number of portfolio trades or block trades that were larger than $1bn. 1-2 per month was typical during 2023 but in September 2024 alone, we saw 9 such transactions. Market liquidity conditions continue to be robust.
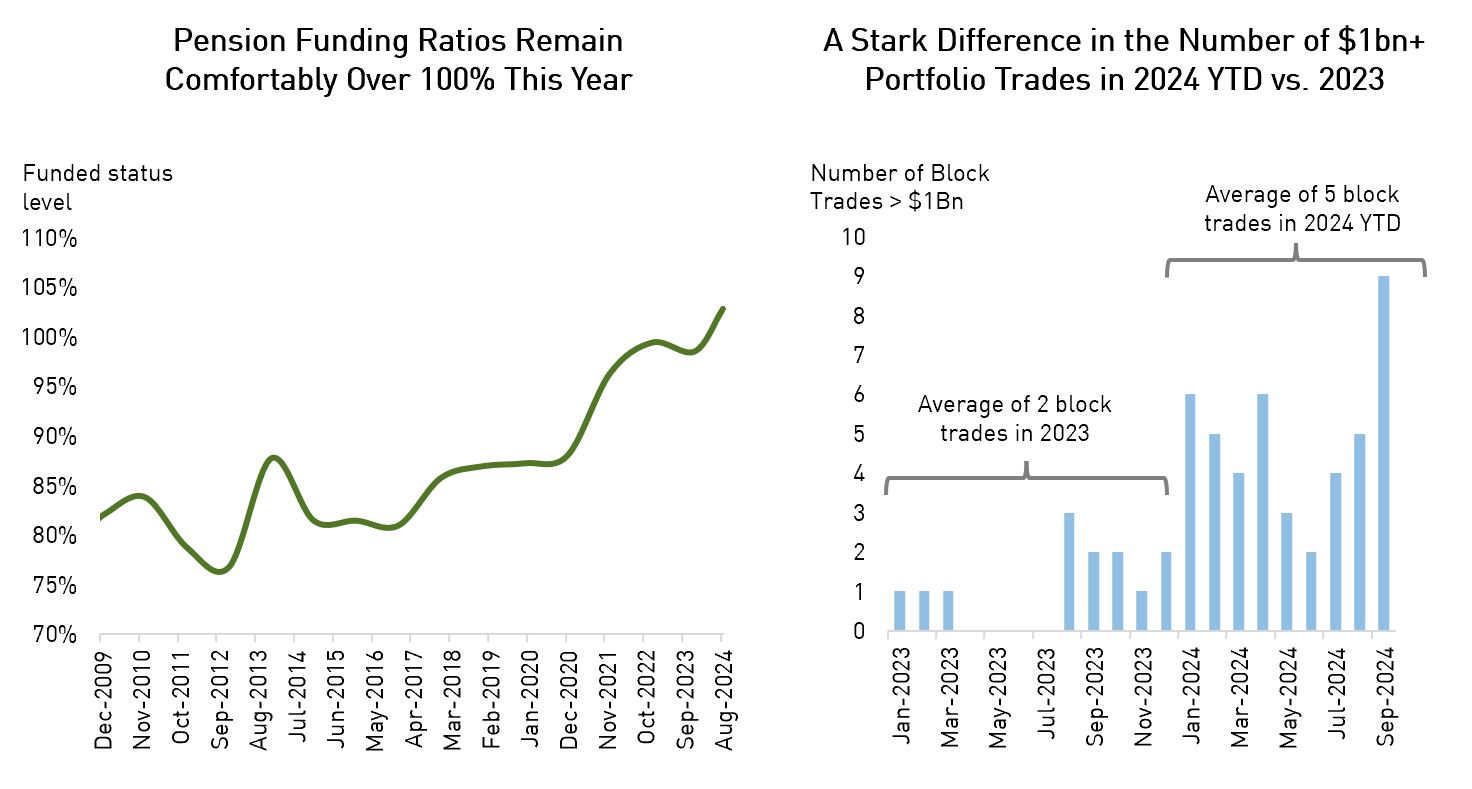
Source: Milliman Inc. Data as of August 31, 2024. Funded status is shown using the Milliman 100 Pension Funding Ratio for Private Defined Benefit Pension Plans.
Important Information
The information herein is presented by RP Investment Advisors LP (“RPIA”) and is for informational purposes only. It does not provide financial, legal, accounting, tax, investment, or other advice and should not be acted or relied upon in that regard without seeking the appropriate professional advice. The information is drawn from sources believed to be reliable, but the accuracy or completeness of the information is not guaranteed, nor in providing it does RPIA assume any responsibility or liability whatsoever. The information provided may be subject to change and RPIA does not undertake any obligation to communicate revisions or updates to the information presented. Unless otherwise stated, the source for all information is RPIA. The information presented does not form the basis of any offer or solicitation for the purchase or sale of securities. Products and services of RPIA are only available in jurisdictions where they may be lawfully offered and to investors who qualify under applicable regulation. RPIA managed strategies and funds carry the risk of financial loss. Performance is not guaranteed and past performance may not be repeated.
Commissions, trailing commissions, management fees and expenses all may be associated with mutual fund investments. Please read the prospectus before investing. Indicated rates of return include changes in share or unit value and reinvestment of all dividends or distributions and do not take into account sales, redemption, distribution or optional charges or income taxes payable by any securityholder that would have reduced returns. Returns for time periods of more than one year are historical annual compounded total returns while returns for time periods of one year or less are cumulative figures and are not annualized. Mutual funds are not guaranteed, their values change frequently and past performance may not be repeated. The compound growth chart is used only to illustrate the effects of a compound growth rate and is not intended to reflect future values or returns of the Fund.
The index performance comparisons presented are intended to illustrate the historical performance of the indicated strategies compared with that of the specified market index over the indicated period. The comparison is for illustrative purposes only and does not imply future performance. There are various differences between an index and an investment strategy or fund that could affect the performance and risk characteristics of each. Market indices are not directly investable and index performance does not account for fees, expense and taxes that might be applicable to an investment strategy or fund. “Forward-Looking” statements are based on assumptions made by RPIA regarding its opinion and investment strategies in certain market conditions and are subject to a number of mitigating factors. Economic and market conditions may change, which may materially impact actual future events and as a result RPIA’s views, the success of RPIA’s intended strategies as well as its actual course of conduct.


