
As we head into the first quarter of 2025, we have compiled five charts that we think highlight some of the key themes and opportunities we see in the current market environment. Please feel free to contact us if you would like to discuss these themes further or learn more about how we could help you meet your investment objectives.
1. Sticky Inflation May Limit the Depth of Rate Cutting Cycles
Recent data in the U.S. shows signs that the decline in inflation has stalled, with most measures settling above the 2% target. Moreover, there is a risk of reacceleration if Trump enacts his potentially inflationary policies.
U.S. inflation data will be critical in determining whether we see further interest rate cuts in 2025, or whether the Fed will need to pause altogether or even increase the overnight rate. These dynamics will likely influence the Bank of Canada’s monetary policy decisions, as policymakers must balance a much weaker economic backdrop with the potential impact of higher-for-longer U.S. rates. Predicting the future path of monetary policy and risk-free yields is challenging, so we plan to continue to rely on data and take an active and flexible approach when determining our interest rate exposure.
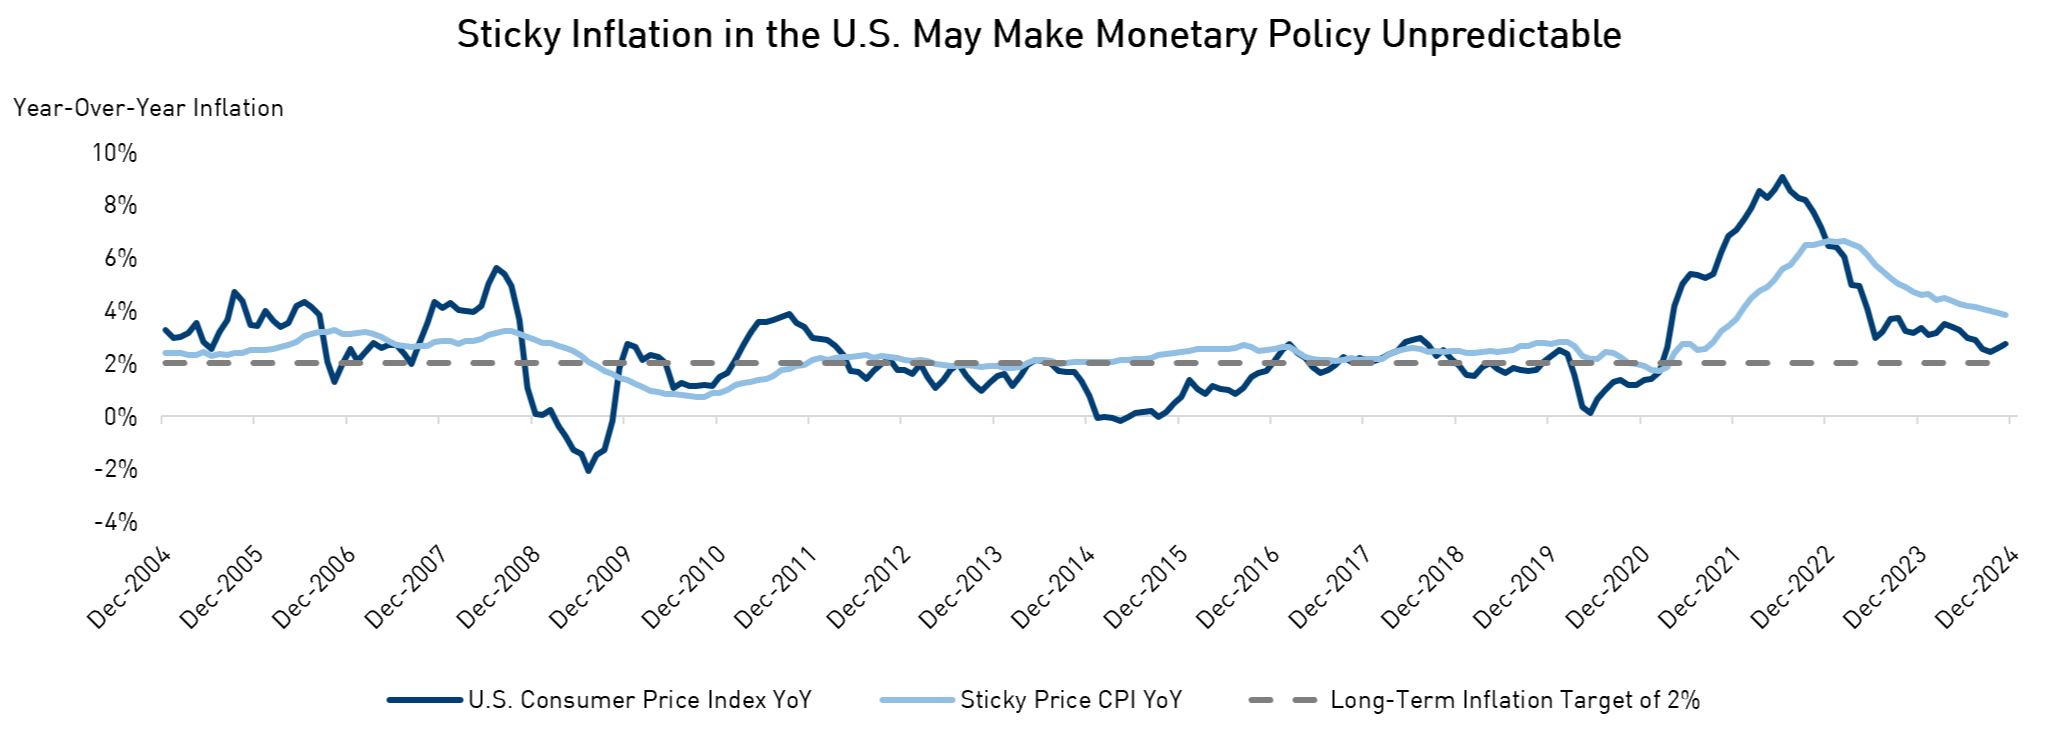
Source: Bureau of Labor Statistics, Federal Reserve Bank of Atlanta. Data as of November 30, 2024.
2. Corporate Fundamentals Support Credit Valuations
Despite tighter monetary conditions, profit margins for investment grade issuers have continued to expand this year. Although leverage has ticked up, it is, on average, still within its historical range. Considering global central banks have cut policy rates, corporate balance sheets can continue to be quite strong and can underpin resilient credit spread valuations.
Nonetheless, balance sheet strength varies across sectors and geographies, especially when accounting for potential geopolitical implications. As such, we believe active management and acute credit selection will be paramount to generating alpha in 2025.
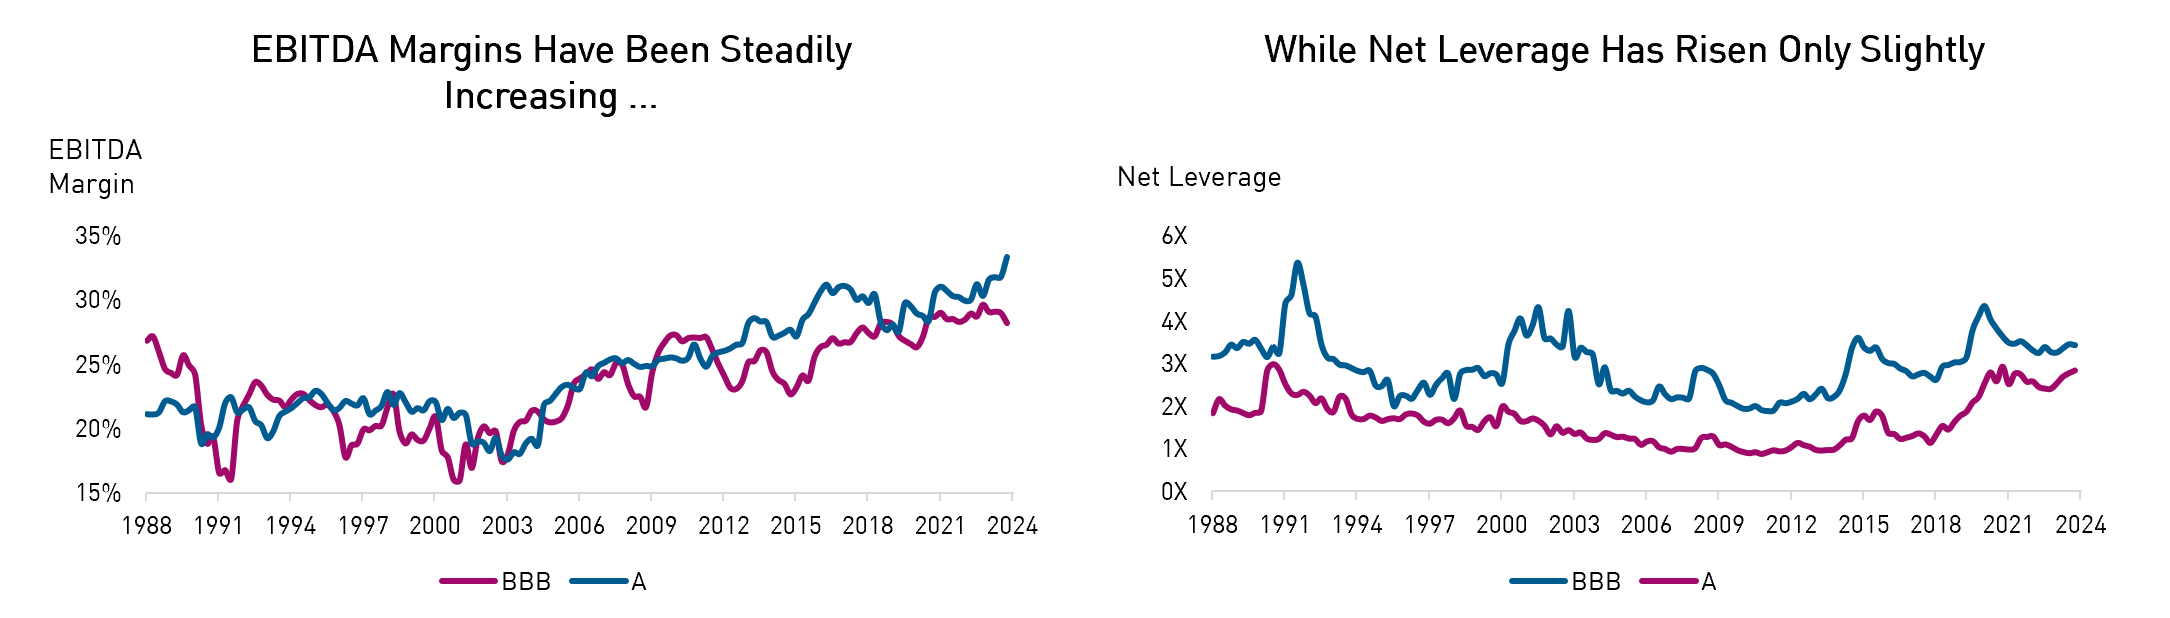
Source: Barclays. Data as of September 30, 2024.
3. Yield Sensitive Buyers Continue to Drive Demand for Bonds
All-in yields of corporate bonds (i.e., the risk-free yield plus credit spread) were above 5% for most of 2024 – the most attractive levels since the Great Financial Crisis. As a result, yield-focused buyers who conduct liability management (like pensions and insurance companies) maintained robust demand for credit in 2024.
In fact, U.S. annuity sales, which contribute to strong credit demand, were on a record pace through the first three quarters of 2024. With all-in yields still well above the 5% mark entering 2025, we expect the trend of strong annuity sales to continue and act as a tailwind for credit.

Source: LIMRA. Data as of September 30, 2024.
4. Normalizing Yield Curve Could Ignite the Redeployment of Money Market Assets
Assets in money market instruments currently sit at all-time highs (~$6.8T) as elevated short-term yields incentivized investors to pile in during 2023 and 2024. This capital can be viewed as cash on the sidelines or dry powder as investors await better opportunities further out the curve. Ultimately, we expect a normalizing yield curve to ignite a rotation out of money market funds and into bonds.
This phenomenon is occurring alongside central bank rate cuts, making the opportunity cost of sitting in cash expensive again. In fact, yields on investment grade credit now yield >1% more than short-term treasury bills for the first time in two years. We believe that a continued normalization of the yield curve could fuel the redeployment of money market assets and drive fixed income demand in 2025.
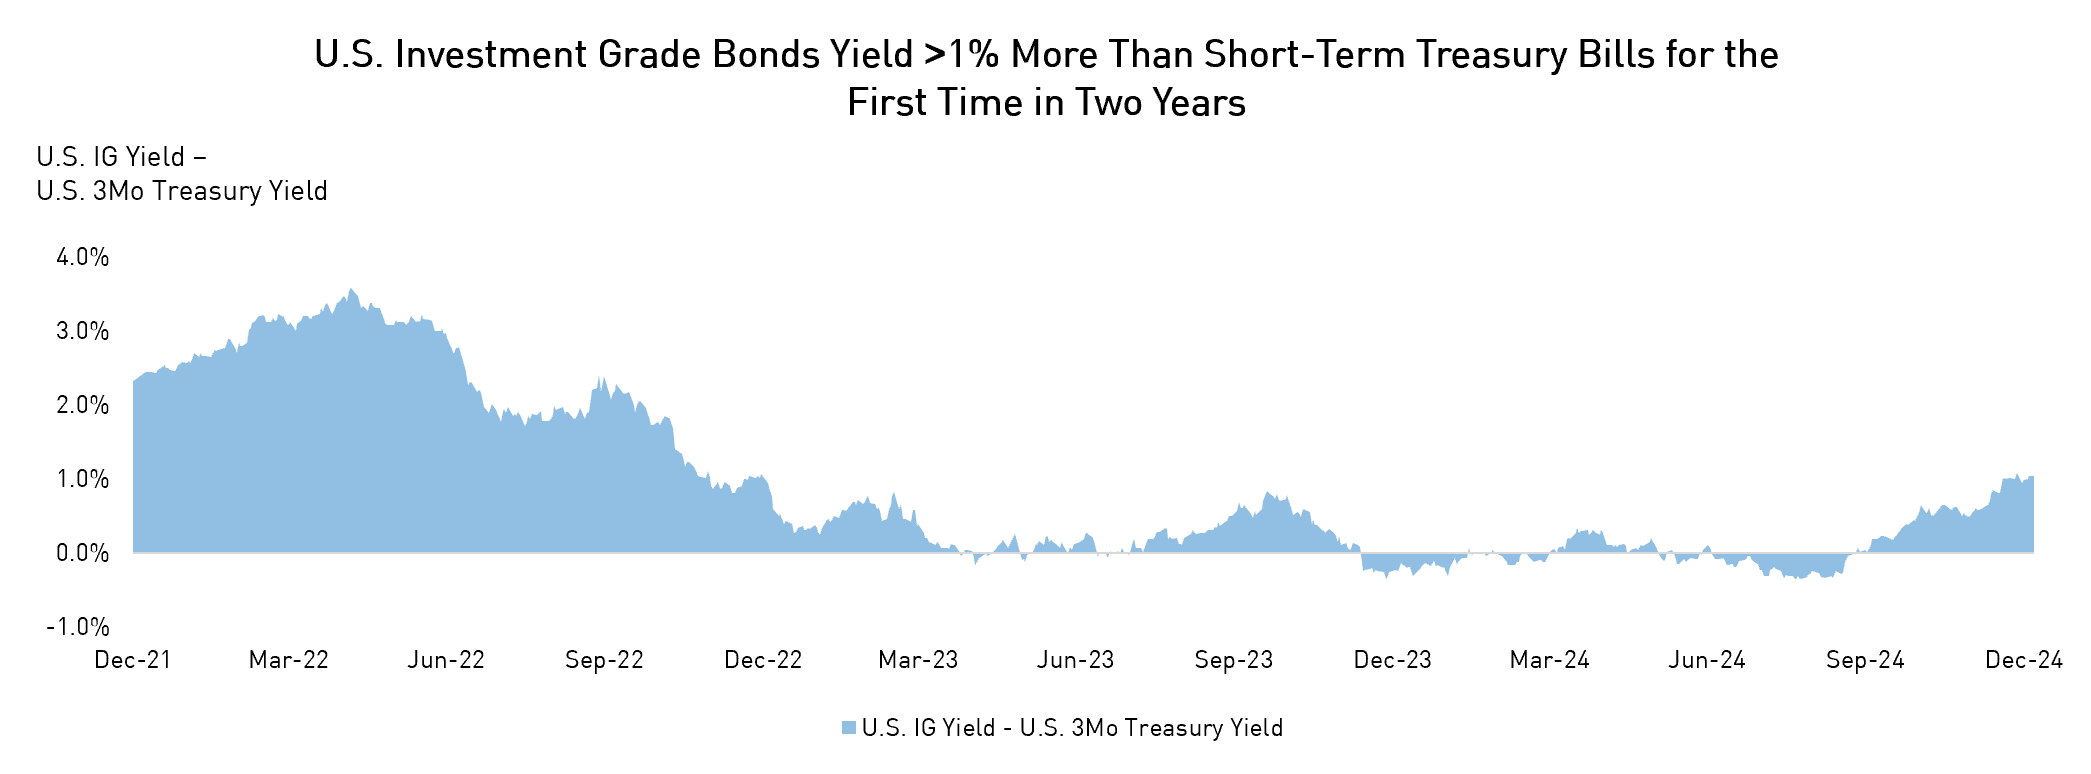
Source: ICE BofAML, Department of the Treasury. Data as of January 6th, 2025.
5. Growing Popularity of Portfolio Trades Can Dampen Volatility
A key theme in the public credit markets in 2024 was the sharp growth in Portfolio Trades (“PT”) – a way of executing trades of large baskets of bonds in a simple transaction. Within the investment grade market, PT accounted for almost a quarter of all trade volumes this year. The strong growth in PT enhances liquidity across the bond market and offers another avenue for large bond managers to access liquidity.
PT adoption is expected to continue growing in 2025, a trend that many market participants believe will act as a volatility dampener as the price discovery process in credit markets becomes more efficient.
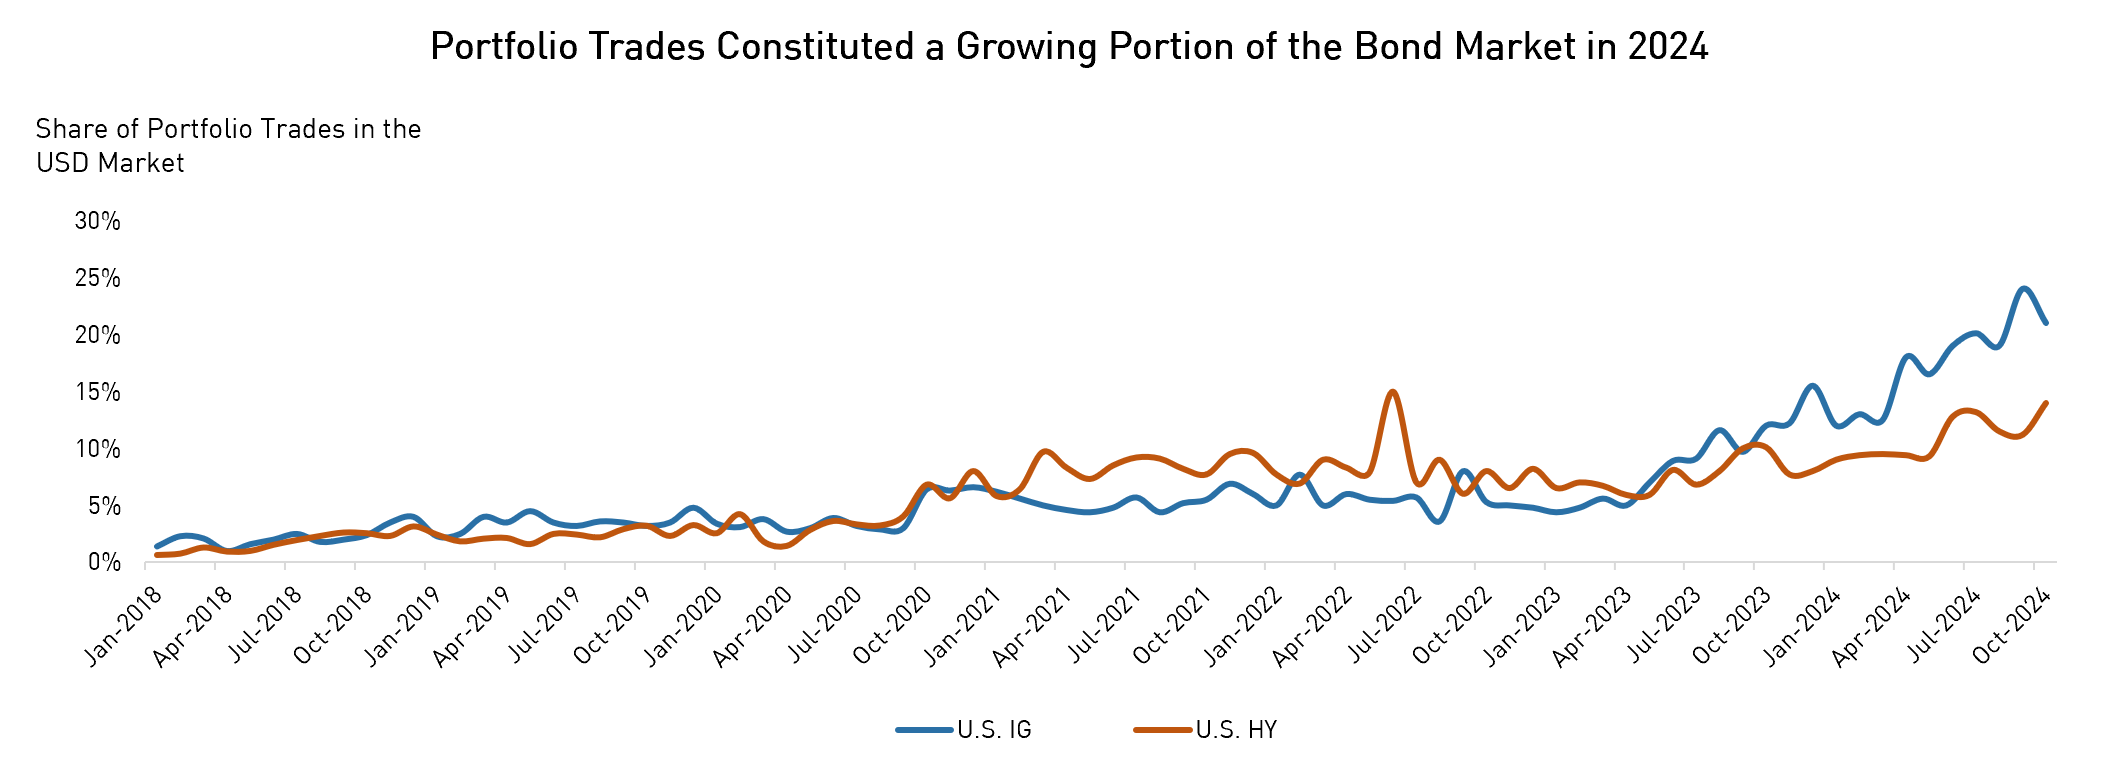
Source: Bloomberg. Data as of October 31, 2024.
Important Information
The information herein is presented by RP Investment Advisors LP (“RPIA”) and is for informational purposes only. It does not provide financial, legal, accounting, tax, investment, or other advice and should not be acted or relied upon in that regard without seeking the appropriate professional advice. The information is drawn from sources believed to be reliable, but the accuracy or completeness of the information is not guaranteed, nor in providing it does RPIA assume any responsibility or liability whatsoever. The information provided may be subject to change and RPIA does not undertake any obligation to communicate revisions or updates to the information presented. Unless otherwise stated, the source for all information is RPIA. The information presented does not form the basis of any offer or solicitation for the purchase or sale of securities. Products and services of RPIA are only available in jurisdictions where they may be lawfully offered and to investors who qualify under applicable regulation. RPIA managed strategies and funds carry the risk of financial loss. Performance is not guaranteed and past performance may not be repeated.
Commissions, trailing commissions, management fees and expenses all may be associated with mutual fund investments. Please read the prospectus before investing. Indicated rates of return include changes in share or unit value and reinvestment of all dividends or distributions and do not take into account sales, redemption, distribution or optional charges or income taxes payable by any securityholder that would have reduced returns. Returns for time periods of more than one year are historical annual compounded total returns while returns for time periods of one year or less are cumulative figures and are not annualized. Mutual funds are not guaranteed, their values change frequently and past performance may not be repeated. The compound growth chart is used only to illustrate the effects of a compound growth rate and is not intended to reflect future values or returns of the Fund.
The index performance comparisons presented are intended to illustrate the historical performance of the indicated strategies compared with that of the specified market index over the indicated period. The comparison is for illustrative purposes only and does not imply future performance. There are various differences between an index and an investment strategy or fund that could affect the performance and risk characteristics of each. Market indices are not directly investable and index performance does not account for fees, expense and taxes that might be applicable to an investment strategy or fund. “Forward-Looking” statements are based on assumptions made by RPIA regarding its opinion and investment strategies in certain market conditions and are subject to a number of mitigating factors. Economic and market conditions may change, which may materially impact actual future events and as a result RPIA’s views, the success of RPIA’s intended strategies as well as its actual course of conduct.