
RP Select Opportunities
| 1 MON | 3 MON | 6 MON | YTD | 1 YR | 3 YR | 5 YR | 10 YR | Since Inception | |
|---|---|---|---|---|---|---|---|---|---|
| RP Select Opportunities Strategy | 0.79% | 1.43% | 3.80% | 0.79% | 4.50% | 8.57% | 7.78% | 8.79% | 8.03% |
Source: RPIA. Data as of 1/31/2026. SOF = RP Select Opportunities. SI = 04/2014. RP Select Opportunities strategy performance presented above is a hypothetical illustration based on the weighted average composite return of a separately managed account utilizing a similar strategy from inception in April 2014 to May 2014, then linked to the returns of RP Select Opportunities Cayman Fund Ltd. – Class C Lead.
SOF returned +0.79% during the month, generating outsized returns from credit spread exposure on both an absolute and relative basis.
High-yield credit spreads underperformed investment-grade counterparts as concerns about private credit and software-related loans spilled over into public markets, widening high-yield spreads into month-end. The portfolio’s up-in-quality bias relative to passive high-yield strategies proved advantageous, as the Fund generated outsized returns from credit spread exposure on both an absolute and a relative basis.
| Top Contributors to Credit Return (Sector) |
|---|
| Financials |
| Real Estate |
| Industrials |
Source: RPIA. Data as of 1/31/2026.
| Top Contributors to Credit Return (Issuer) |
|---|
| Domtar Corp |
| Western Alliance Bank |
| CPI Property Group SA |
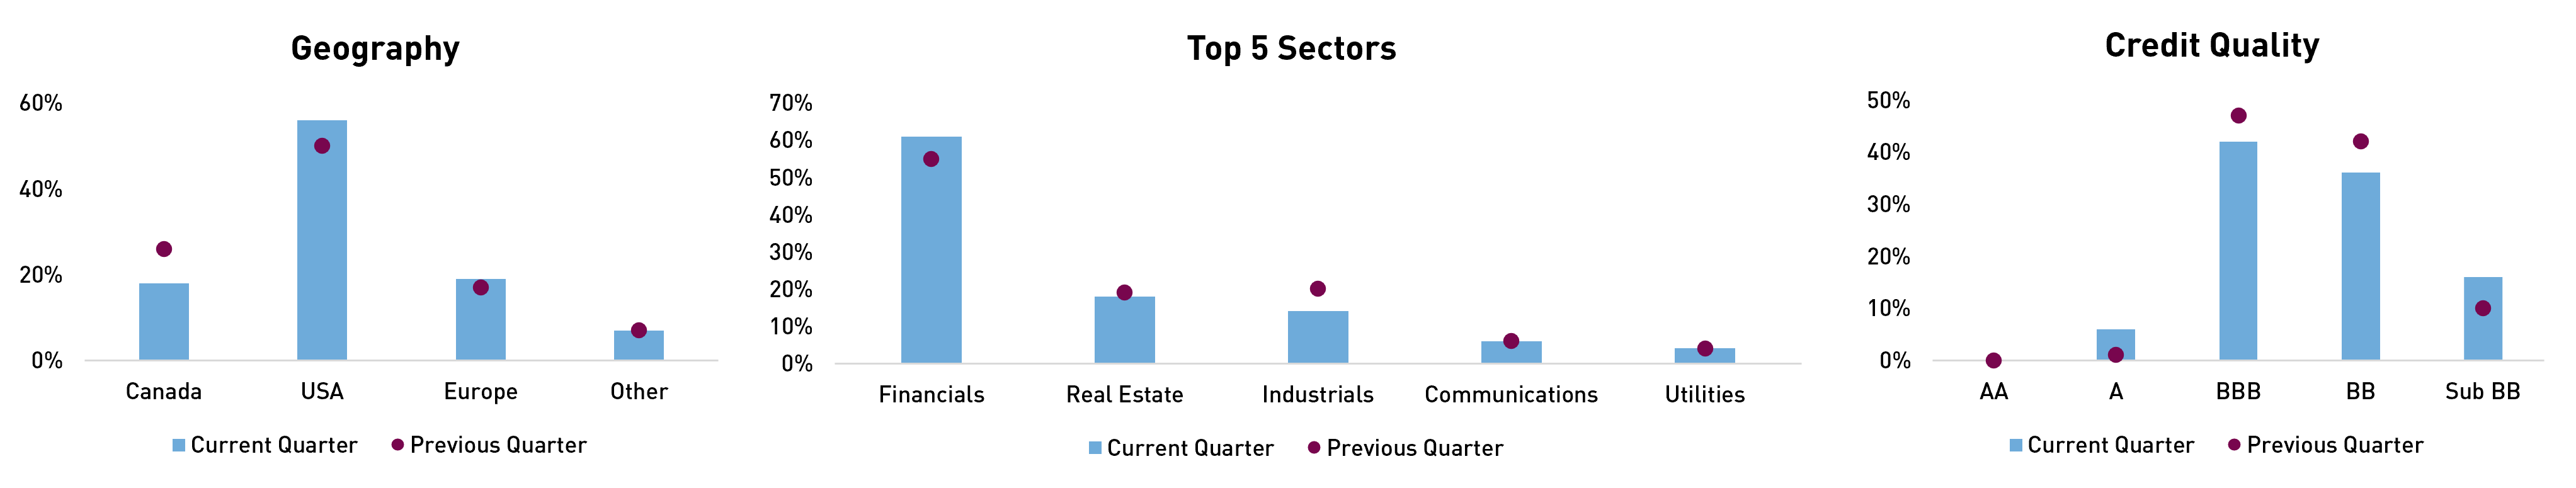
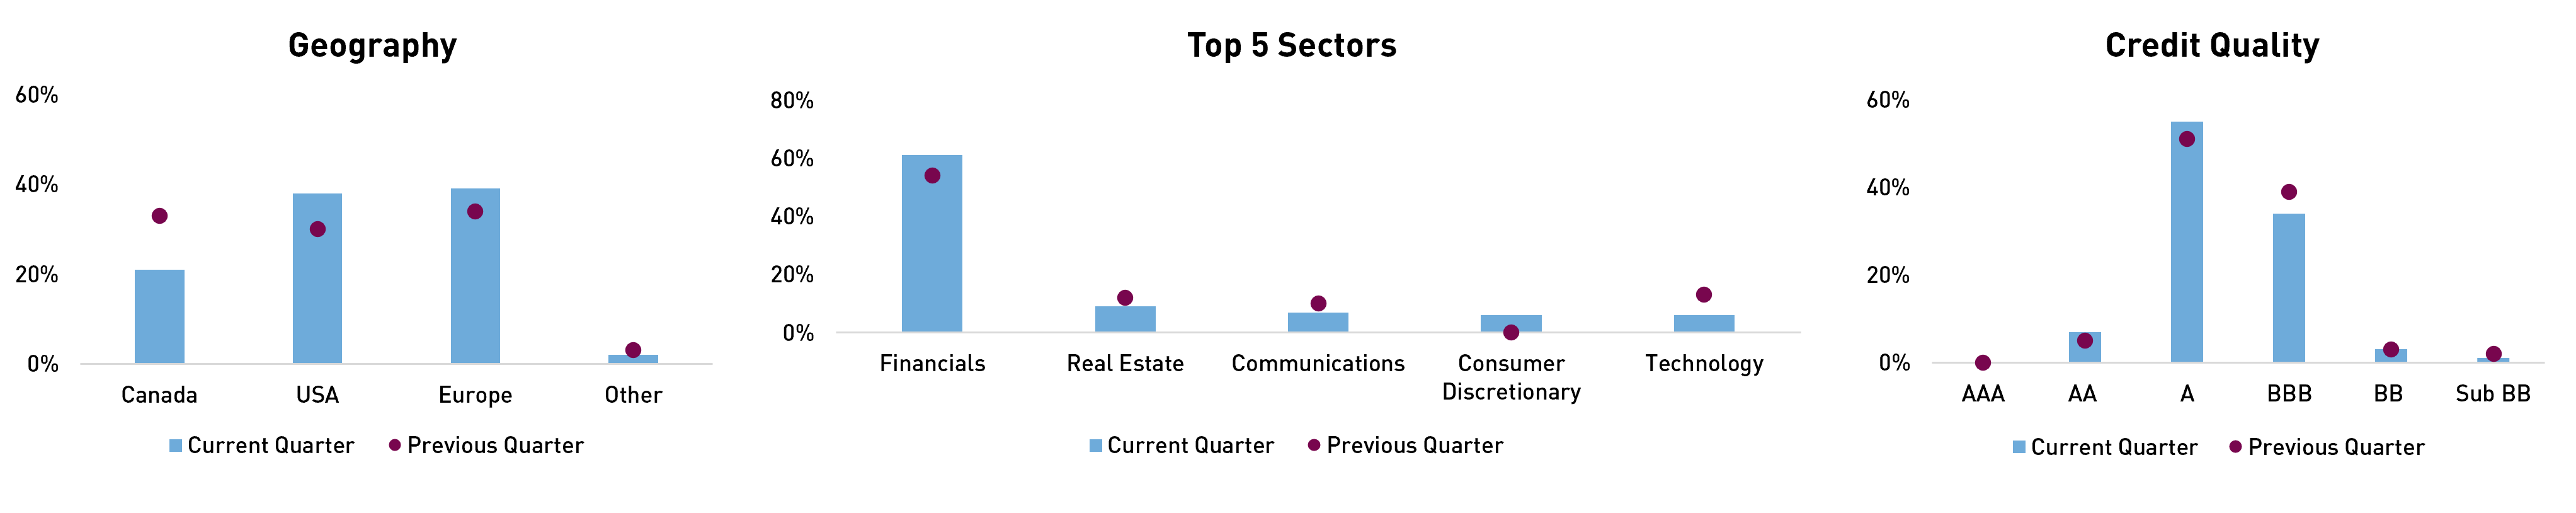
Credit risk remained subdued during the quarter, opting to isolate unique opportunities rather than embed broad market exposure at expensive valuations. Geographically, the portfolio monetized well-performing US credit in favour of rotating into lower-beta domestic exposures and non-North American opportunities. Sector-wise, single-name shorts were implemented or added to within the more cyclical consumer discretionary and material sectors. The portfolio remains nearly 50% investment grade, and high yield exposure is fully concentrated in BB and B rated bonds, continuing to opt against diving into lower quality segments of the market. We believe the portfolio’s more conservative stance sets us up to take advantage of compelling opportunities as they emerge. In the meantime, we aim to continue providing investors with an effective alternative to traditional fixed income, equity, and private asset allocations.
Overall, the Strategy’s conservative yet active positioning provides flexibility to capitalize on compelling opportunities as they arise, while continuing to offer investors an effective alternative to traditional fixed income, equity, and private asset allocations.
| Jan 2026 | Q4 2025 | |
|---|---|---|
| Effective Duration (Years) | 4.8 | 4.0 |
| Credit Duration (Years) | 2.7 | 1.6 |
| Net Credit Leverage | 1.0x | 0.8x |
| % Rated Investment Grade | 48% | 48% |
Source: RPIA. Data as of 1/31/2026.
Source: RPIA. Data as of 1/31/2026.
RP Debt Opportunities
| 1 MON | 3 MON | 6 MON | YTD | 1 YR | 3 YR | 5 YR | 10 YR | Since Inception | |
|---|---|---|---|---|---|---|---|---|---|
| RP Debt Opportunities | 0.67% | 0.47% | 1.93% | 0.67% | 3.85% | 6.47% | 5.16% | 5.86% | 7.45% |
Source: RPIA. Data as of 01/31/2026. DOF = RP Debt Opportunities. SI = 10/2009. RP Debt Opportunities strategy performance presented above represents a composite return of RP Debt Opportunities Fund LP Class A and RP Debt Opportunities Fund Ltd. Class A, from October 2009 to July 2011 and RP Debt Opportunities Fund Ltd. Class A. from August 2011 onwards.
DOF returned +0.67% during the month, generating positive returns from both credit spread and interest rate exposure.
Risk markets largely looked through a range of geopolitical and policy headlines, including developments around Venezuela and the Federal Reserve. Against this backdrop, credit spreads tightened (rallied) as robust demand continued to overwhelm record investment-grade bond supply, benefiting the Strategy’s long credit exposures. Active interest rate management - particularly the portfolio’s focus on the front end of the CAD and UK yield curve – also contributed meaningfully to performance.
| Top Contributors to Credit Return (Sector) |
|---|
| Financials |
| Real Estate |
| Consumer Discretionary |
Source: RPIA. Data as of 1/31/2026.
| Top Contributors to Credit Return (Issuer) |
|---|
| CPI Property Group SA |
| Credit Agricole SA |
| Foundry JV Holdco LLC |
| Jan 2026 | Q4 2025 | |
|---|---|---|
| Effective Duration (Years) | 3.4 | 4.2 |
| Credit Duration (Years) | 3.3 | 0.8 |
| Net Credit Leverage | 0.5x | 0.2x |
| % Rated Investment Grade | 99% | 99% |
Source: RPIA. Data as of 1/31/2026.
Source: RPIA. Data as of 1/31/2026.
RP Fixed Income Plus
| 1 MON | 3 MON | 6 MON | YTD | 1 YR | 3 YR | 5 YR | 10 YR | Since Inception | |
|---|---|---|---|---|---|---|---|---|---|
| RP Fixed Income Plus | 0.42% | 0.42% | 2.22% | 0.42% | 4.18% | 4.94% | 2.86% | 2.78% | 3.65% |
| FTSE Canada Universe Short-Term Bond Index | 0.45% | 0.37% | 2.18% | 0.45% | 3.43% | 4.55% | 1.92% | 2.08% | 2.36% |
| Added Value | -0.03% | +0.05% | +0.04% | -0.03% | +0.75% | +0.39% | +0.94% | +0.70% | +1.29% |
Source: RPIA. FTSE Russell. Data as of 1/31/2026 and annualized for periods greater than one year. SI = 07/2010. RP Fixed Income Plus strategy performance presented above represents a weighted-average composite return of separately managed accounts utilizing a similar strategy from inception in July 2010 to April 2013 and linked to the returns of the RP Fixed Income Plus Fund, Series A thereafter.
FIP returned +0.42% during the month, performing roughly in line with the FTSE Canada Universe Short-Term Bond Index (the “Index”).
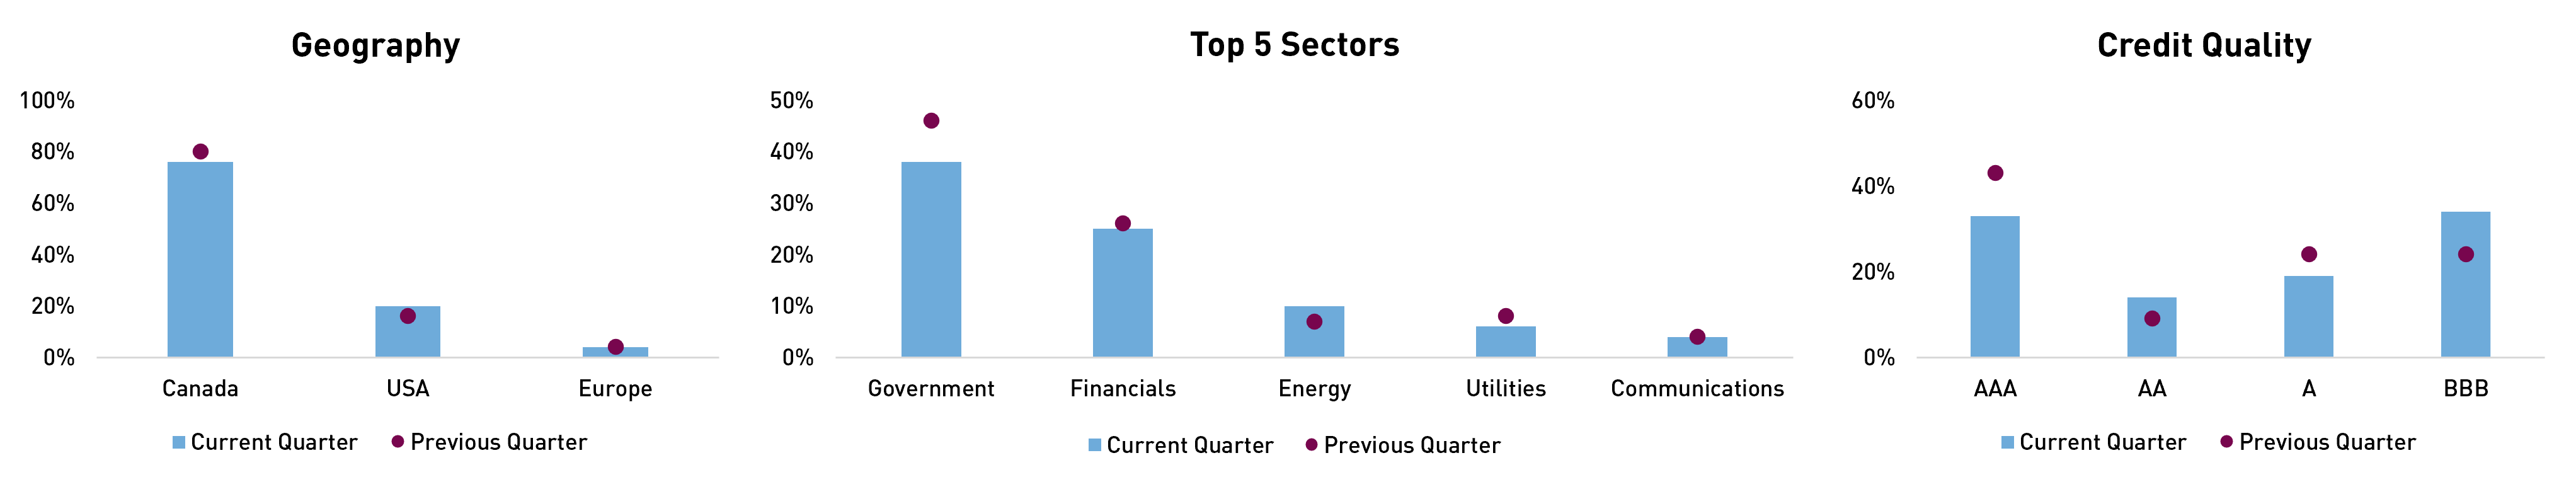
The Strategy generated positive returns from both interest rates and credit spreads, with credit contributing incremental alpha relative to the Index. Credit performance was driven by domestic systemically important banks and high-conviction positions in energy utilities, including South Bow USA (a former TC Energy spinoff) and Inter Pipeline. Additional alpha was generated from positions in short-dated, CAD-denominated Ford bonds, USD-denominated Hyundai bonds, and select USD-denominated technology issuers.
| Top Contributors to Credit Return (Sector) |
|---|
| Financials |
| Energy |
| Utilities |
Source: RPIA. Data as of 1/31/2026.
| Top Contributors to Credit Return (Issuer) |
|---|
| Canada Imperial Bank of Commerce |
| Royal Bank of Canada |
| The Toronto Dominion Bank |
| Jan 2026 | Q4 2025 | |
|---|---|---|
| Effective Duration (Years) | 2.9 | 2.8 |
| Credit Duration (Years) | 2.0 | 1.7 |
| Average Term (Years) | 3.0 | 3.1 |
| % Rated Investment Grade | 100% | 100% |
Source: RPIA. Data as of 1/31/2026.
Source: RPIA. Data as of 1/31/2026.
RP Strategic Income Plus Fund
| 1 MON | 3 MON | 6 MON | YTD | 1 YR | 3 YR | 5 YR | Since Inception | |
|---|---|---|---|---|---|---|---|---|
| RP Strategic Income Plus Fund (Class F) | 0.44% | -0.14% | 2.30% | 0.44% | 3.65% | 4.88% | 2.62% | 3.81% |
Source: RPIA. Data as of 01/31/2026. STIP Class F = RP Strategic Income Plus Fund Class F (RPD110). SI = 04/2016.
STIP returned +0.44% during the month, generating positive returns from both credit spread and interest rate exposure.
| Top Contributors to Credit Return (Sector) |
|---|
Utilities |
Financials |
| Energy Infrastructure |
Source: RPIA. Data as of 1/31/2026.
| Top Contributors to Credit Return (Issuer) |
|---|
| BPC Generation Infrastructure Trust |
| Electricite de France SA |
| Foundry JV Holdco LLC |
| Jan 2026 | Q4 2025 | |
|---|---|---|
| Effective Duration (Years) | 5.4 | 5.7 |
| Credit Duration (Years) | 4.3 | 3.4 |
| % Rated Investment Grade | 99% | 99% |
Source: RPIA. Data as of 1/31/2026.
Source: RPIA. Data as of 1/31/2026.
RP Alternative Global Bond Fund
| 1 MON | 3 MON | 6 MON | YTD | 1 YR | 3 YR | 5 YR | Since Inception | |
|---|---|---|---|---|---|---|---|---|
| RP Alternative Global Bond Fund (Class F) | 0.78% | 0.66% | 2.67% | 0.78% | 6.46% | 7.48% | 5.79% | 6.47% |
Source: RPIA. Data as of 01/31/2026. AGB Class F = RP Alternative Global Bond Fund Class F (RPD210). SI = 07/2019.
AGB returned +0.78% during the month, generating positive returns from both credit spread and interest rate exposure.
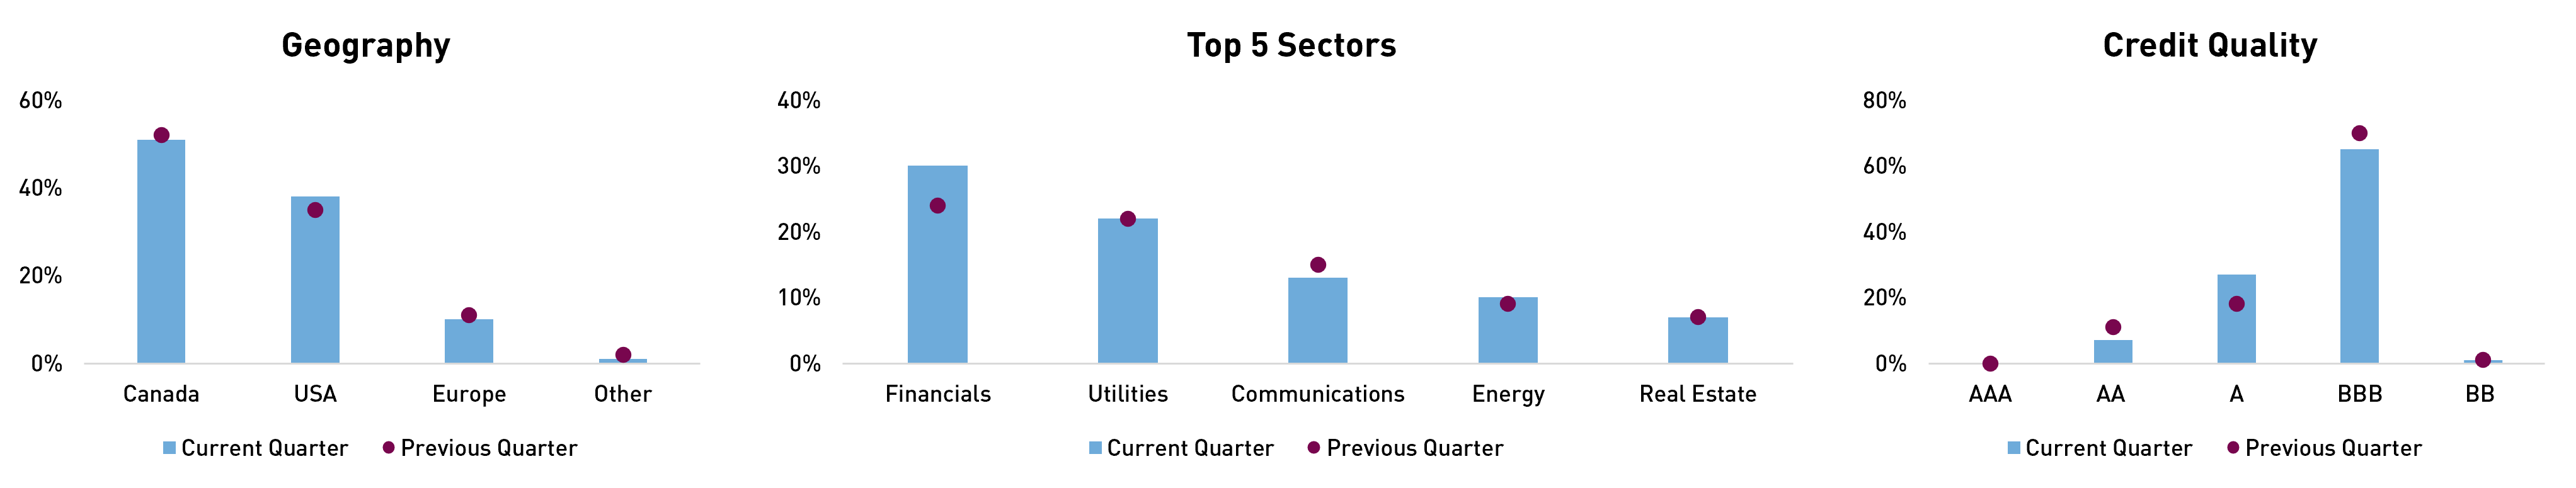
High-quality EUR- and USD-denominated global systemically important banks and Yankee banks led credit returns. Within this theme, the portfolio increased exposure across the capital stack of French national banks through an active new-issue market and benefited from solid performance in its existing Crédit Agricole SA Tier 2 Maple position. Additional contributions came from select idiosyncratic positions backed by strong fundamental conviction, including exposures in technology (Foundry JV), real estate (CPI Property Group), and consumer discretionary (Gildan Activewear). While portfolio hedges were a net detractor during the period, they remain an important component of risk management given compressed index level spread valuations.
| Top Contributors to Credit Return (Sector) |
|---|
| Financials |
| Real Estate |
| Technology |
Source: RPIA. Data as of 1/31/2026.
| Top Contributors to Credit Return (Issuer) |
|---|
| Credit Agricole SA |
| CPI Property Group SA |
| UBS Group AG |
| Jan 2026 | Q4 2025 | |
|---|---|---|
| Effective Duration (Years) | 4.5 | 5.7 |
| Credit Duration (Years) | 3.5 | 0.9 |
| Net Credit Leverage | 0.5x | 0.2x |
| % Rated Investment Grade | 97% | 96% |
Source: RPIA. Data as of 1/31/2026.
Source: RPIA. Data as of 1/31/2026.
RP Alternative Credit Opportunities Fund
| Top Contributors to Credit Return (Sector) |
|---|
| Financials |
| Real Estate |
| Industrials |
Source: RPIA. Data as of 1/31/2026.
| Top Contributors to Credit Return (Issuer) |
|---|
| Western Alliance Bank |
| Vivion Investments Sarl |
| CPI Property Group SA |
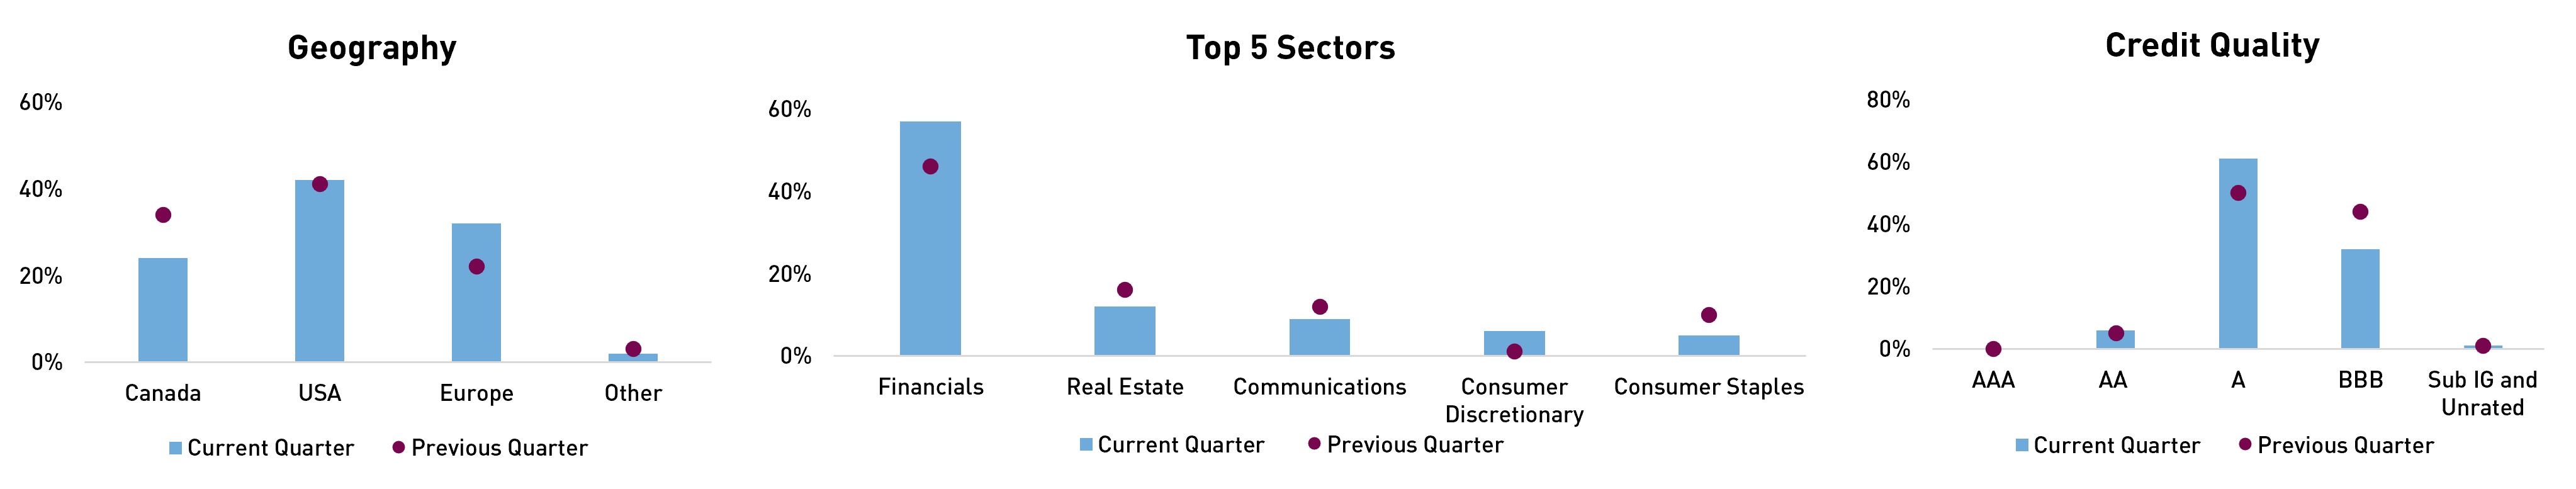
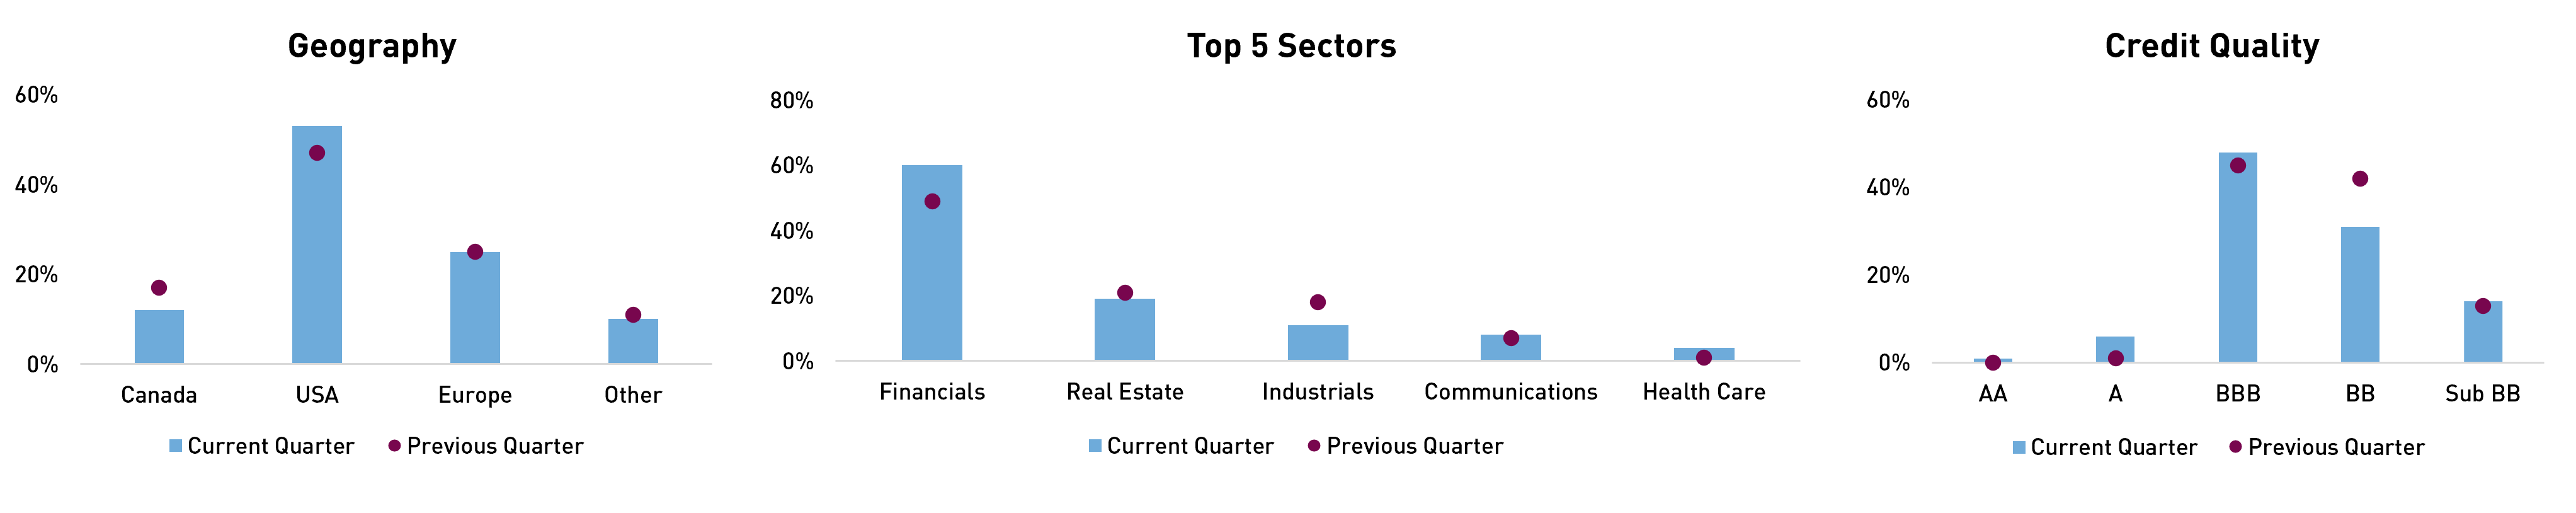
Credit risk remained subdued during the month, as the portfolio continued to focus on idiosyncratic, high-conviction opportunities rather than embedding broad market exposure at elevated valuations. Overall exposure was modestly increased as more attractive opportunities emerged, particularly within USD- and EUR-denominated credit markets. The portfolio remains balanced between investment grade and high yield exposures, with high yield fully concentrated in BB- and B-rated bonds, reflecting our continued preference to avoid lower-quality segments of the market. We remain constructive on financials, select real estate, and industrial exposures, while continuing to deploy short positions in more vulnerable consumer discretionary issuers. We believe the portfolio’s more conservative stance positions it well to capitalize on compelling opportunities as they arise. In the interim, we aim to continue providing investors with an effective alternative to traditional fixed income, equity, and private asset allocations.
| Jan 2026 | Q4 2025 | |
|---|---|---|
| Effective Duration (Years) | 3.5 | 2.9 |
| Credit Duration (Years) | 2.8 | 1.9 |
| Average Term (Years) | 4.7 | 3.9 |
| Net Credit Leverage | 0.8x | 0.6x |
| % Rated Investment Grade | 55% | 45% |
Source: RPIA. Data as of 1/31/2026.
Source: RPIA. Data as of 1/31/2026.