Coming into 2023, many analysts talked about “the year of bonds.” A decisive shift in markets during Q4 allowed 2023 to live up to the hype after a very bumpy ride during the year. Fixed income investors saw significant gains following a pivot in central banks’ tone and increased confidence from markets regarding the chance of an economic “soft landing.”
As we head into 2024, we gathered some key themes and observations we believe will define the year ahead. Given the current economic outlook and valuation levels, we believe there is an opportunity for investors to de-risk portfolios by adding to active credit strategies. These strategies can act as an effective yet simple solution in a potentially choppy environment. The opportunities for active management continue to be attractive, given heightened volatility and market dislocations.
Please feel free to contact us if you would like to discuss these themes further or learn more about how we could help you meet your risk-return objectives.
1. Long-Term Bond Yields Dropped Sharply in Q4 as Investors Sensed a Central Bank "Pivot"
Q4 has seen a significant repricing of the Canadian Yield Curve as markets took the increasingly dovish central bank narrative as a “pivot” they had been waiting for. In response, bond yields dropped by around 100 basis points for all tenors beyond the front end of the yield curve. The US shared similar market sentiment, with employment projections remaining unchanged and inflation expectations decreasing. As a result, the Federal Open Market Committee (“FOMC”) took a final 2023 hike off the table and started talking about cuts in 2024.
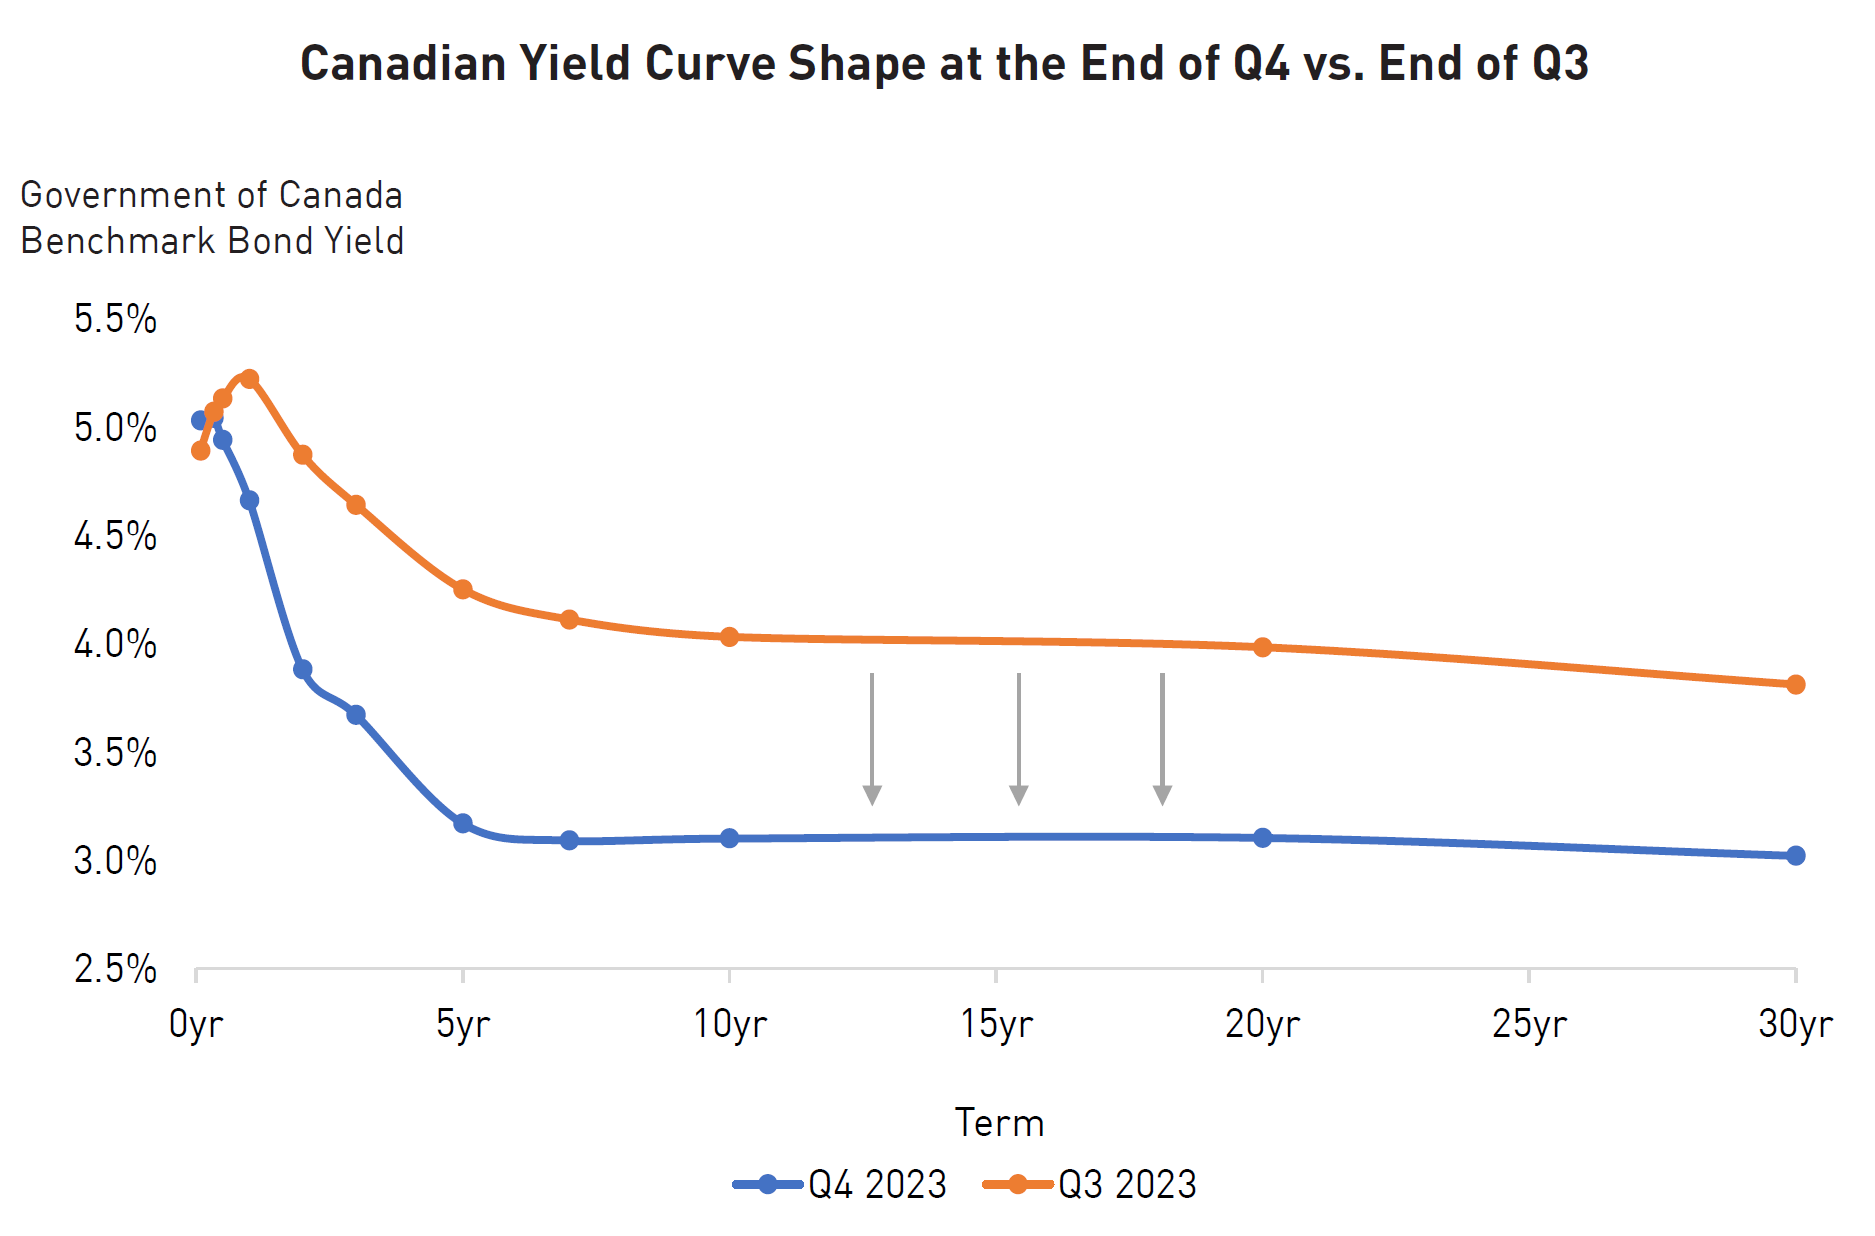
Source: YCharts. Data as of December 31, 2023.
2. Consequently, US 10-Year Yield Finished the Year Almost Unchanged, Having Been as High as 5% in Late October
The 10yr Yield was a rollercoaster in 2023, with moves higher and lower driven by economic data and the perceived response function of central bankers. The US 10yr closed around 3.9% and the Canadian 10yr bond at 3.1%. Most analysts are calling for long-term interest rates to fall further in 2024 – although volatility is expected to remain elevated.
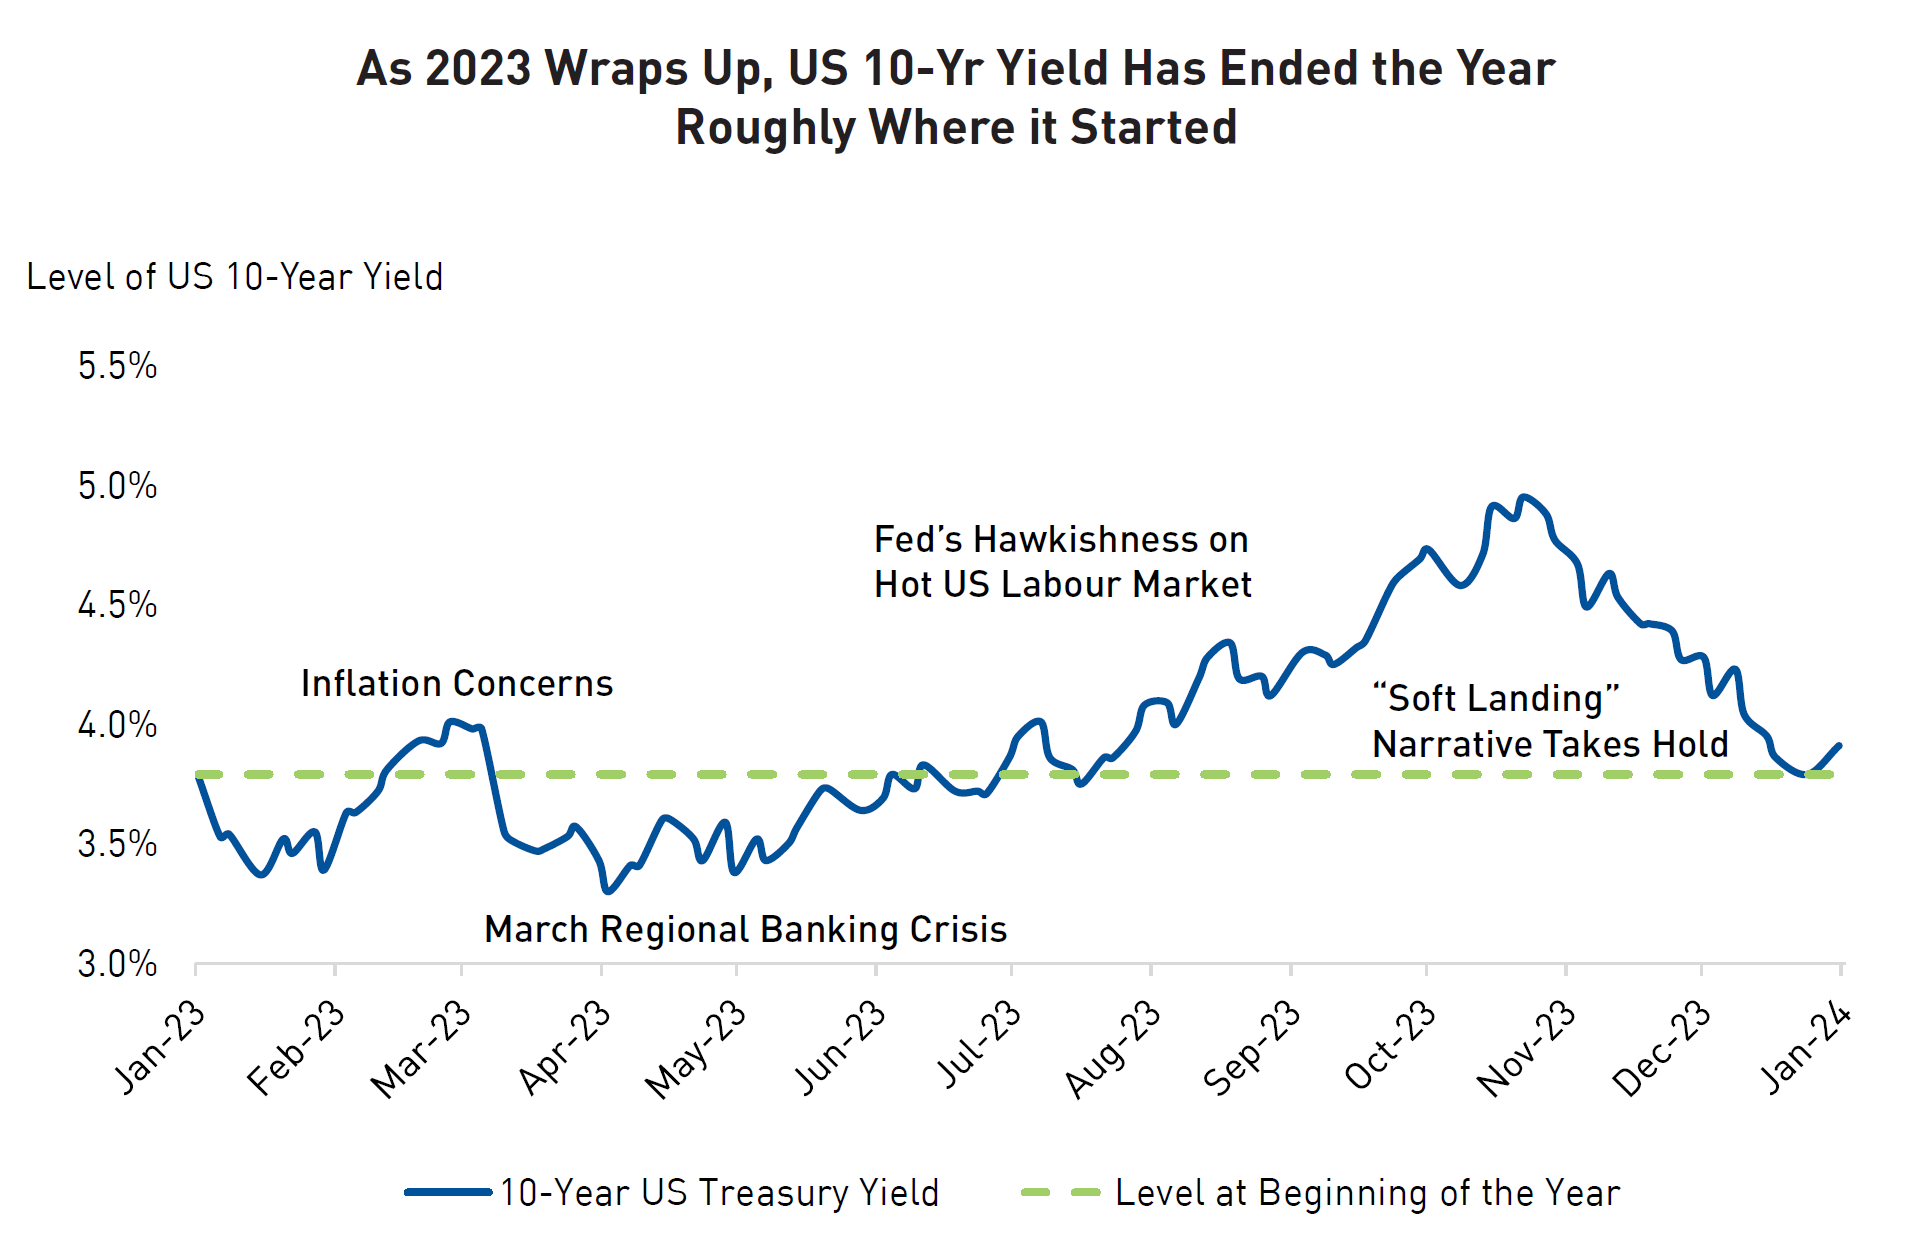
Source: CapitalIQ. Data as of December 31, 2023.
3. During 2023, a Huge Amount of Investor Capital Flowed into Money Market Funds
The asset class that experienced the largest inflow in 2023 was Money Market Funds. The result of this is a nearly $6 trillion cash hoard parked in ultra-safe investments. In the end, risky assets posted strong returns in 2023 thanks to market moves during Q4.
Assuming investors do see a soft landing, we believe a significant portion of those funds may be deployed into corporate bonds and equities, which would support the performance of these asset classes.
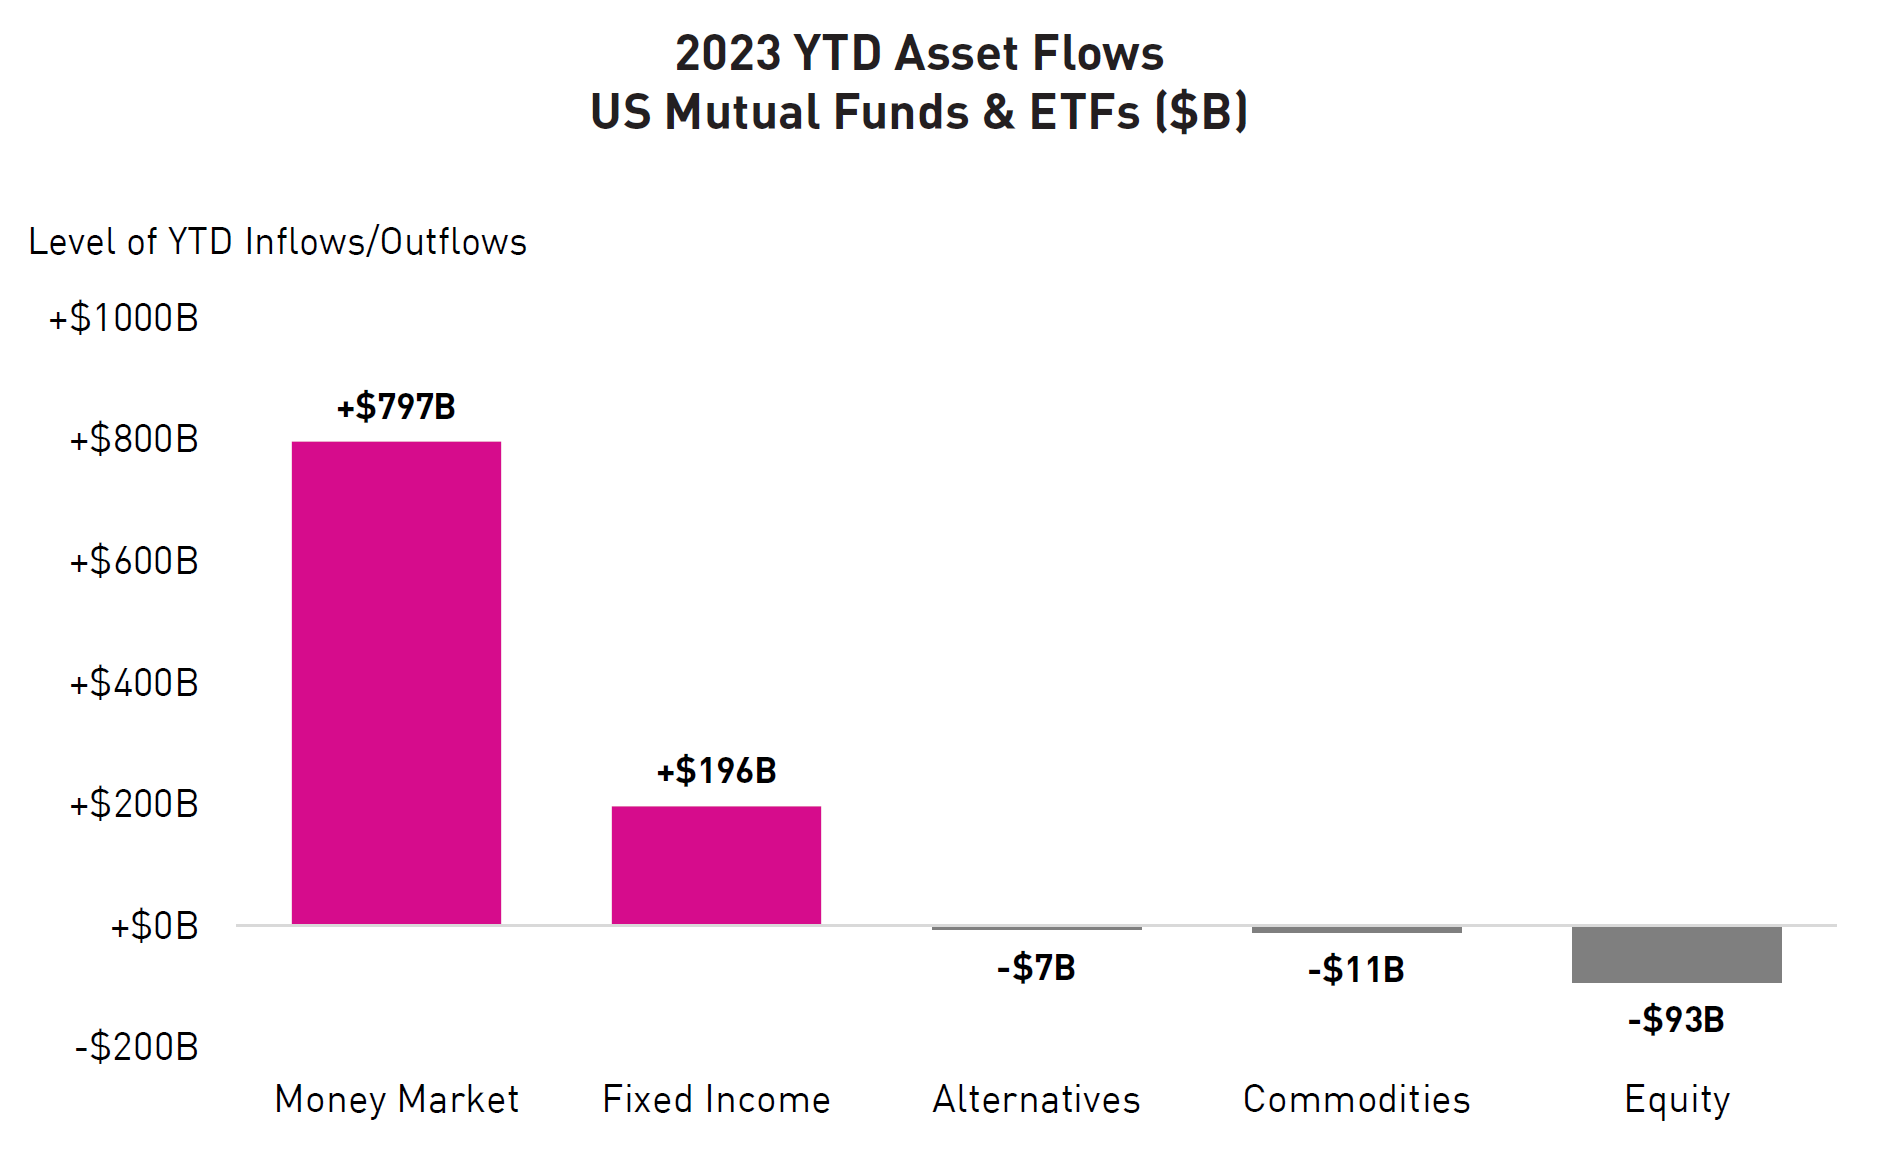
Source: YCharts. Data as of September 30, 2023.
4. Interest Costs for Corporations Will Rise from Historically Low Levels
This chart illustrates that interest burdens have been artificially low in recent years. The increase in interest rates over the past two years will lead to higher borrowing costs in the future as existing debt obligations come due for refinancing. Although some companies prudently locked in long-term debt at attractive levels prior to the rate hike cycle, the ultimate impact of these costs on each company varies. A key element of our credit analysis is looking at refinancing needs for issuers and how that will impact their interest expense going forward.
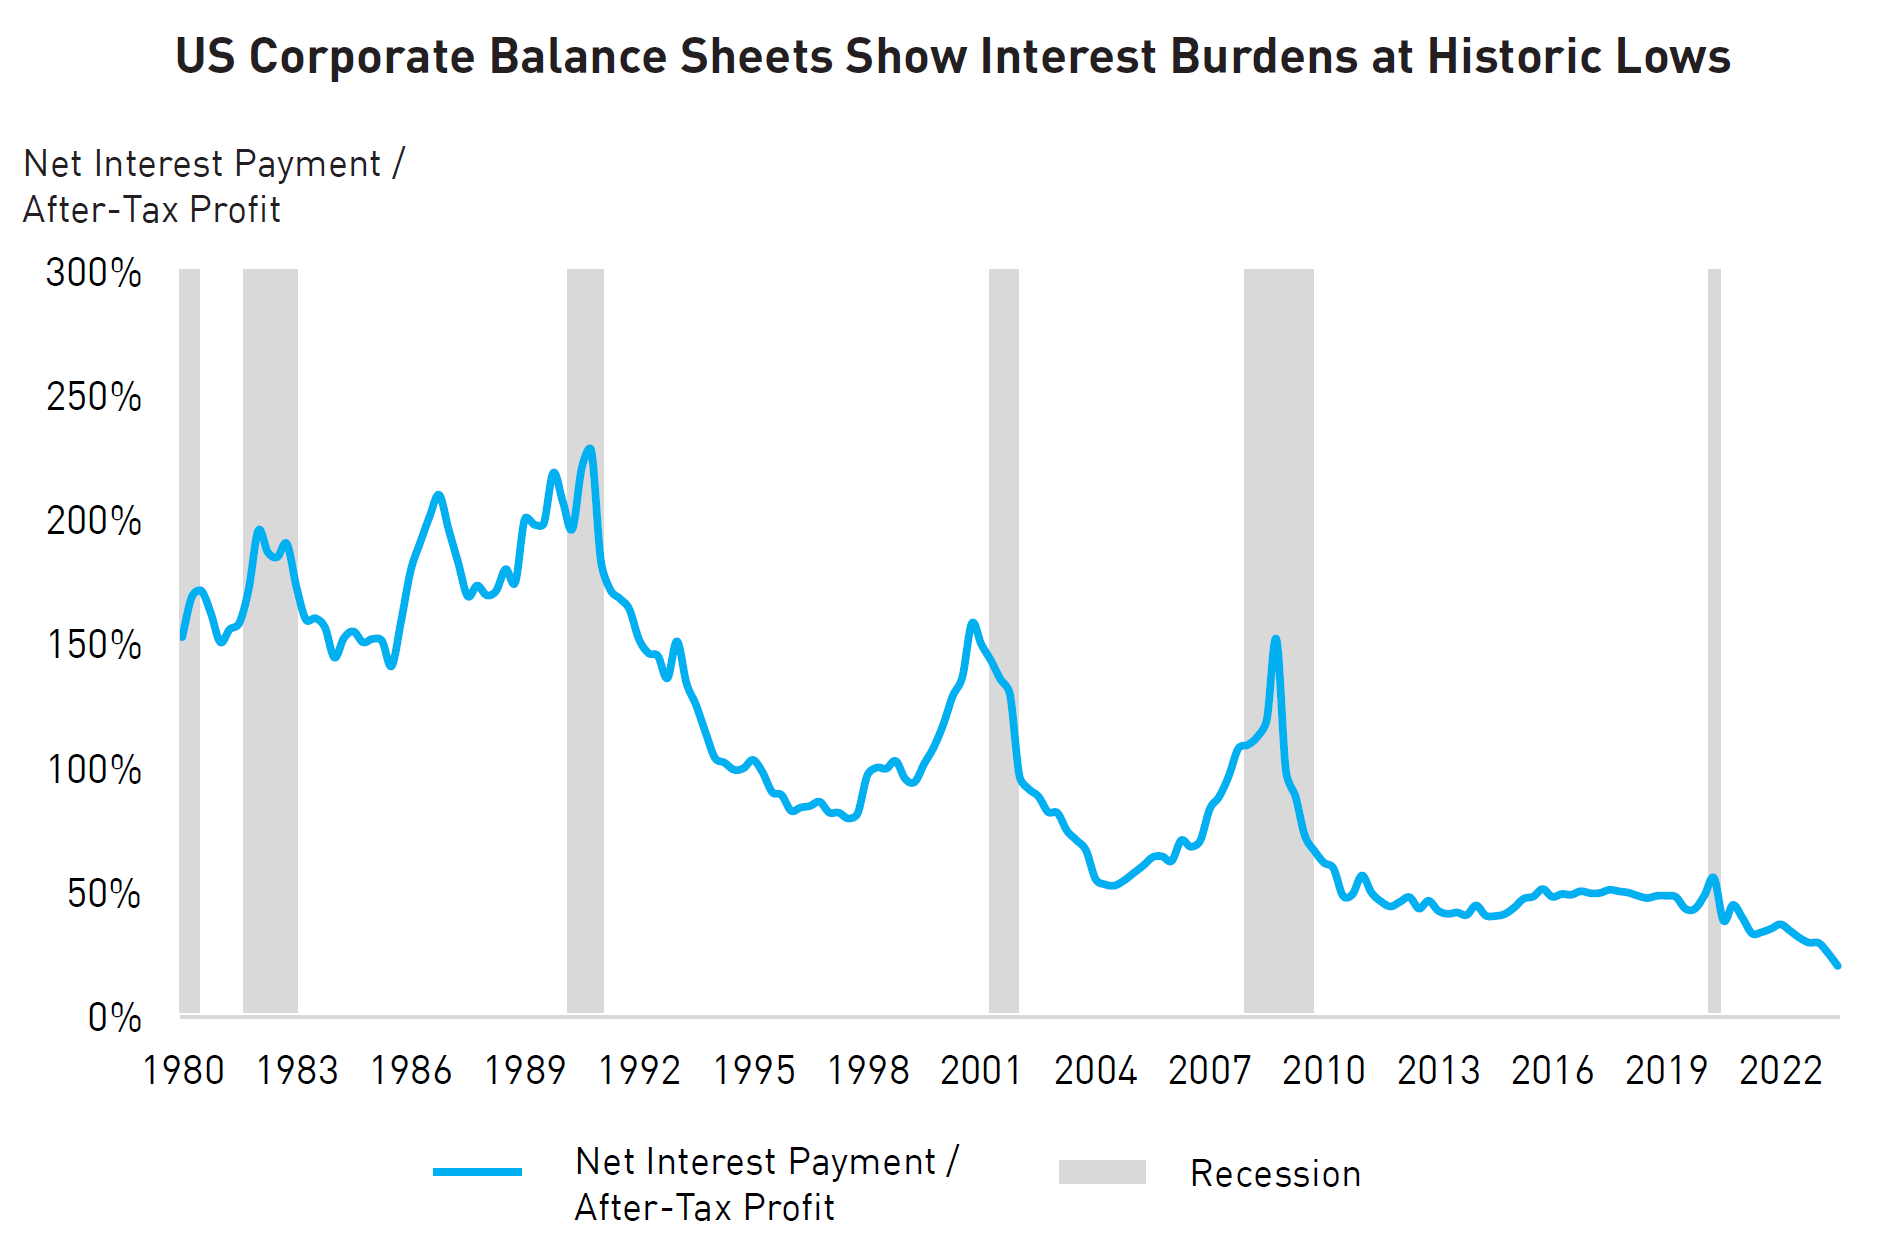
Source: Haver Analytics, US Department of Commerce. Data as of June 30, 2023.
5. Credit Valuation for Consumer Segments at the Tight End of the Range, But Not for Financials and REITs
Credit spreads narrowed in Q4 across all industries and sectors. In consumer-focused sectors (retailers, pharmaceuticals, consumer staples, etc.), credit spreads are approaching the narrowest levels they have been in recent years. Valuations are more generous for Financials (banks and insurance companies) and REITs. However, these sector averages only tell part of the story – the reality is that within each sector, there is a wide range of valuations and plenty of opportunities for active security selection.
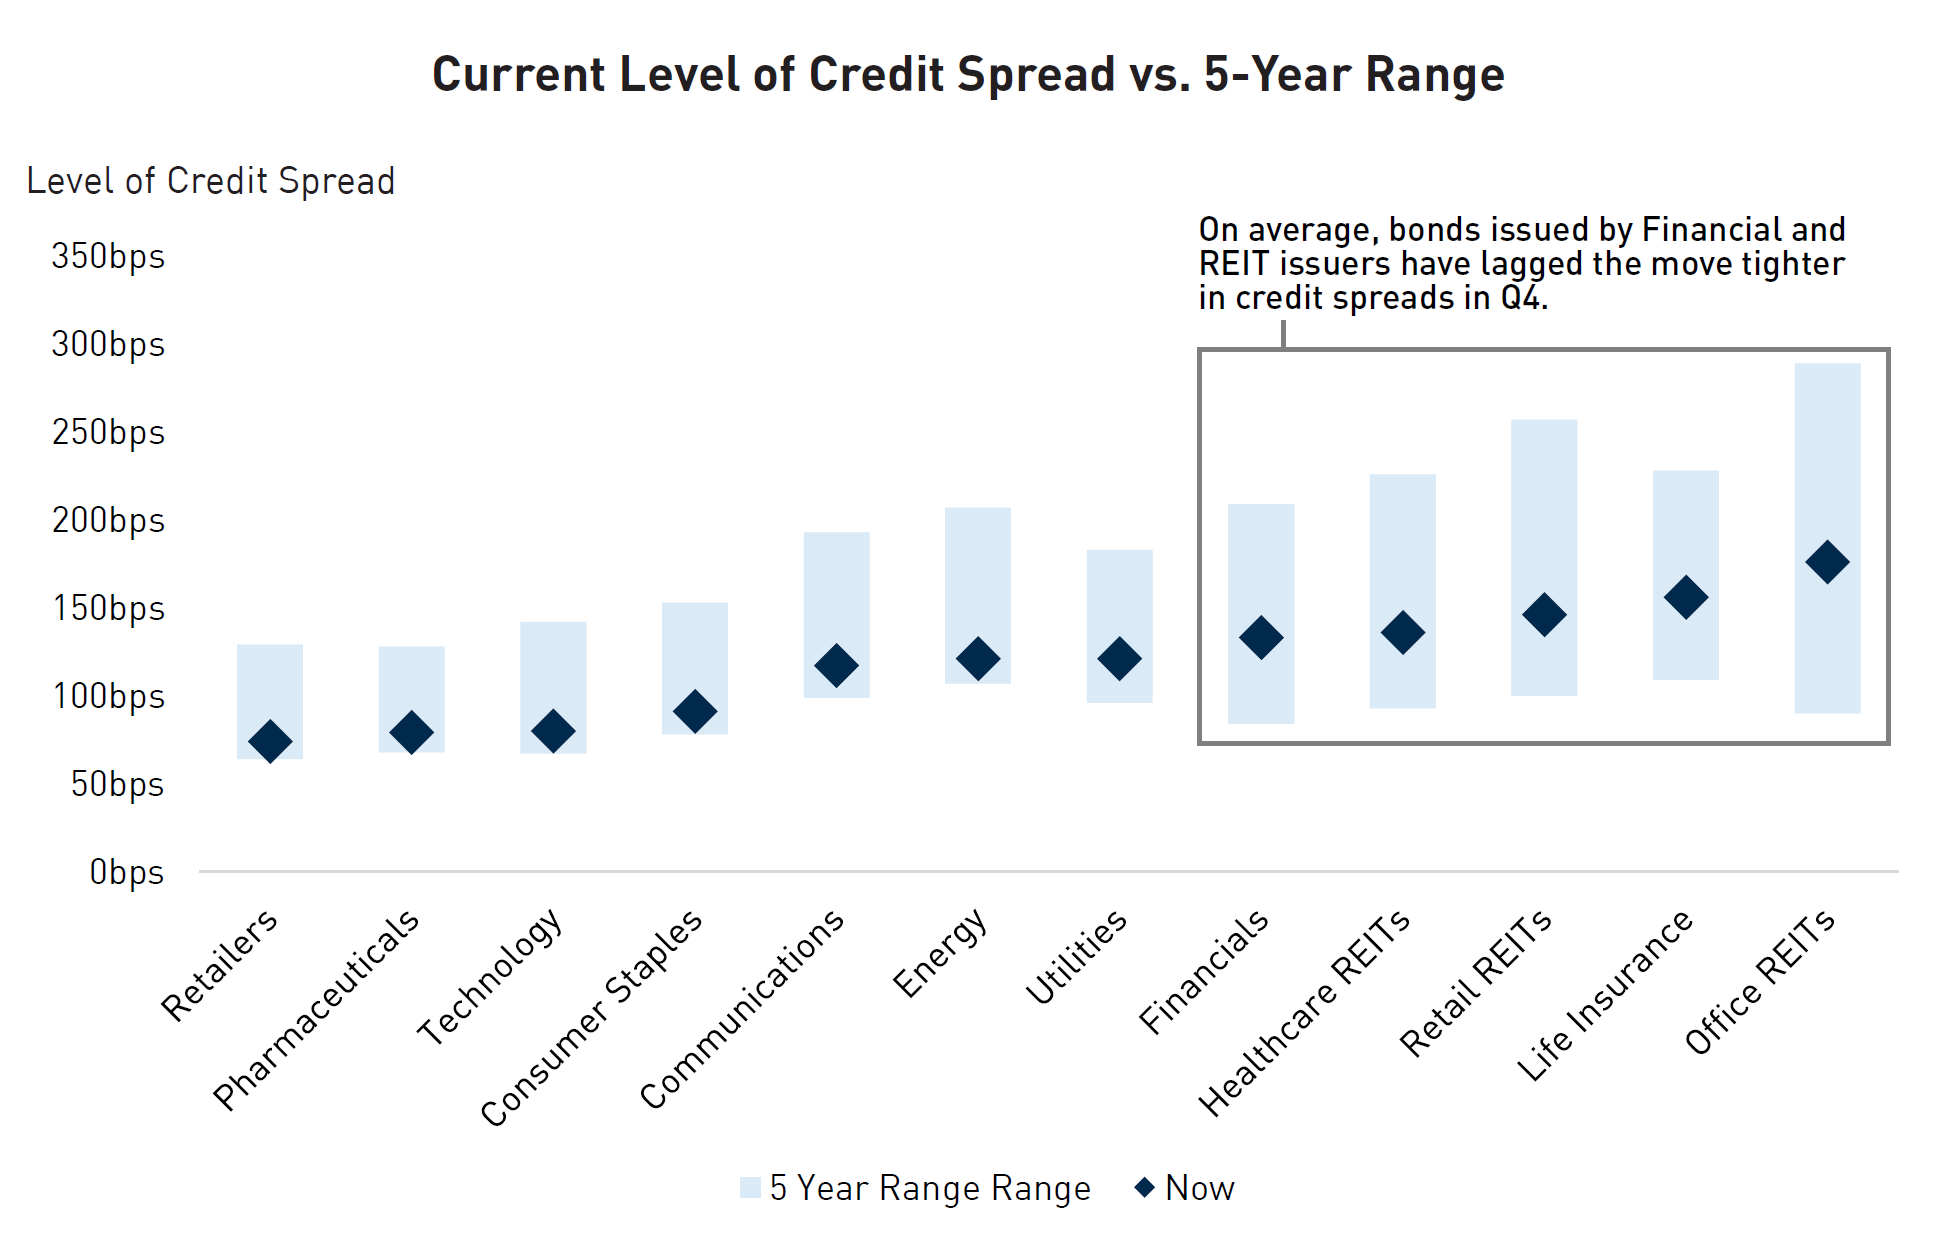
Source: BarclaysLive. Data as of December 31, 2023. Past 5-Year Range excludes covid period (March - May 2020)..
Important Information
The information herein is presented by RP Investment Advisors LP (“RPIA”) and is for informational purposes only. It does not provide financial, legal, accounting, tax, investment, or other advice and should not be acted or relied upon in that regard without seeking the appropriate professional advice. The information is drawn from sources believed to be reliable, but the accuracy or completeness of the information is not guaranteed, nor in providing it does RPIA assume any responsibility or liability whatsoever. The information provided may be subject to change and RPIA does not undertake any obligation to communicate revisions or updates to the information presented. Unless otherwise stated, the source for all information is RPIA. The information presented does not form the basis of any offer or solicitation for the purchase or sale of securities. Products and services of RPIA are only available in jurisdictions where they may be lawfully offered and to investors who qualify under applicable regulation. RPIA managed strategies and funds carry the risk of financial loss. Performance is not guaranteed and past performance may not be repeated.
Commissions, trailing commissions, management fees and expenses all may be associated with mutual fund investments. Please read the prospectus before investing. Indicated rates of return include changes in share or unit value and reinvestment of all dividends or distributions and do not take into account sales, redemption, distribution or optional charges or income taxes payable by any securityholder that would have reduced returns. Returns for time periods of more than one year are historical annual compounded total returns while returns for time periods of one year or less are cumulative figures and are not annualized. Mutual funds are not guaranteed, their values change frequently and past performance may not be repeated. The compound growth chart is used only to illustrate the effects of a compound growth rate and is not intended to reflect future values or returns of the Fund.
The index performance comparisons presented are intended to illustrate the historical performance of the indicated strategies compared with that of the specified market index over the indicated period. The comparison is for illustrative purposes only and does not imply future performance. There are various differences between an index and an investment strategy or fund that could affect the performance and risk characteristics of each. Market indices are not directly investable and index performance does not account for fees, expense and taxes that might be applicable to an investment strategy or fund. “Forward-Looking” statements are based on assumptions made by RPIA regarding its opinion and investment strategies in certain market conditions and are subject to a number of mitigating factors. Economic and market conditions may change, which may materially impact actual future events and as a result RPIA’s views, the success of RPIA’s intended strategies as well as its actual course of conduct.