
Will 2024 finally be the Year of the Bond?
While most bond indices and funds posted modest positive returns during Q1, fixed income markets were volatile as investors continued to assess the likely path of central bank policy. Currently, markets have priced in 3-4 rate cuts in the U.S. and Canada for 2024. However, there continues to be a wide spectrum of opinions – ranging from “no cuts at all” to 5+ cuts. Taken together, yields increased modestly in Q1, although this was partially offset by credit spreads tightening. The market continues to be ripe for active management with plenty of pricing dislocations and relative value opportunities around new issuance.
We believe volatility will continue into the second quarter of this year, but in spite of this, we are very constructive on the bond market. Bond yields still look very attractive by historical standards, both on an absolute basis and relative to other assets classes, and we continue to see opportunities to add significant value from security selection. Of specific note, we believe there are inconsistencies today in the valuations of private credit assets compared to public credit, and believe that investors should be looking to public markets at this time for better mark-to-market risk-adjusted returns.
We have compiled the following five charts, which we think highlight some of the themes and opportunities we see in the current market environment as we head into Q2. Please feel free to contact us if you would like to discuss these themes further or learn more about how we could help you meet your investment objectives.
1. U.S. and Canadian Markets are Pricing in 3 Cuts for 2024, With the Terminal Rate in the 3-3.5% Range
At the start of the year, the market consensus was for 5-6 interest rate cuts in 2024, given the inflation trends at that point. The economic data ended up being more ambiguous, and as a result, expectations have moderated. North American bond markets are currently pricing in around three cuts for the remainder of the year, with the likelihood of further cuts beyond 2024. That said, we believe the path may continue to be bumpy on the road to a lower-rate environment.
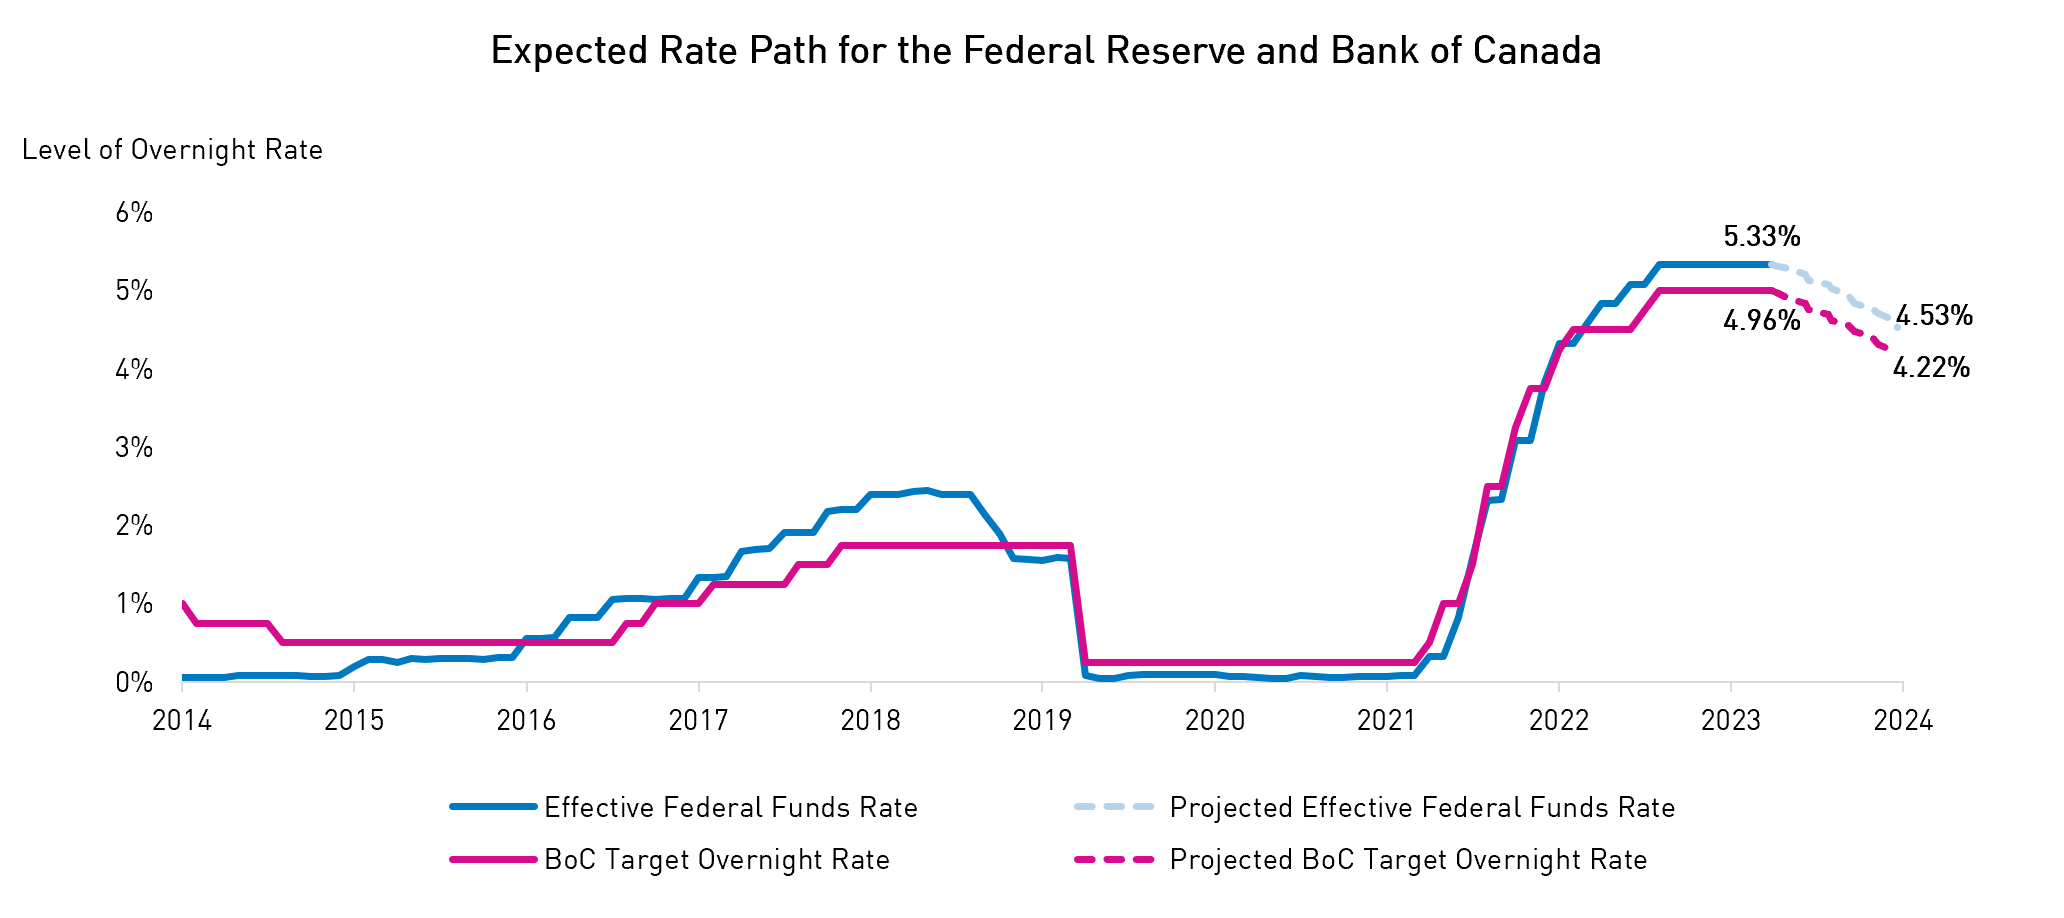
Source: Bloomberg. Data as of March 31, 2024. Data is subject to change. Terminal rates are estimated with 1m3Y OIS futures as a proxy.
2. All-In-Yields are Still Elevated for All Segments of the Fixed Income Market
Investors are still able to benefit from elevated yields across all segments of the fixed income markets, especially when compared to historical medians. We believe yields are particularly attractive in Investment Grade segments of the market compared to more subordinated or lower-rated segments. The majority of the yield increase has come from increases in risk-free rates rather than credit spreads.
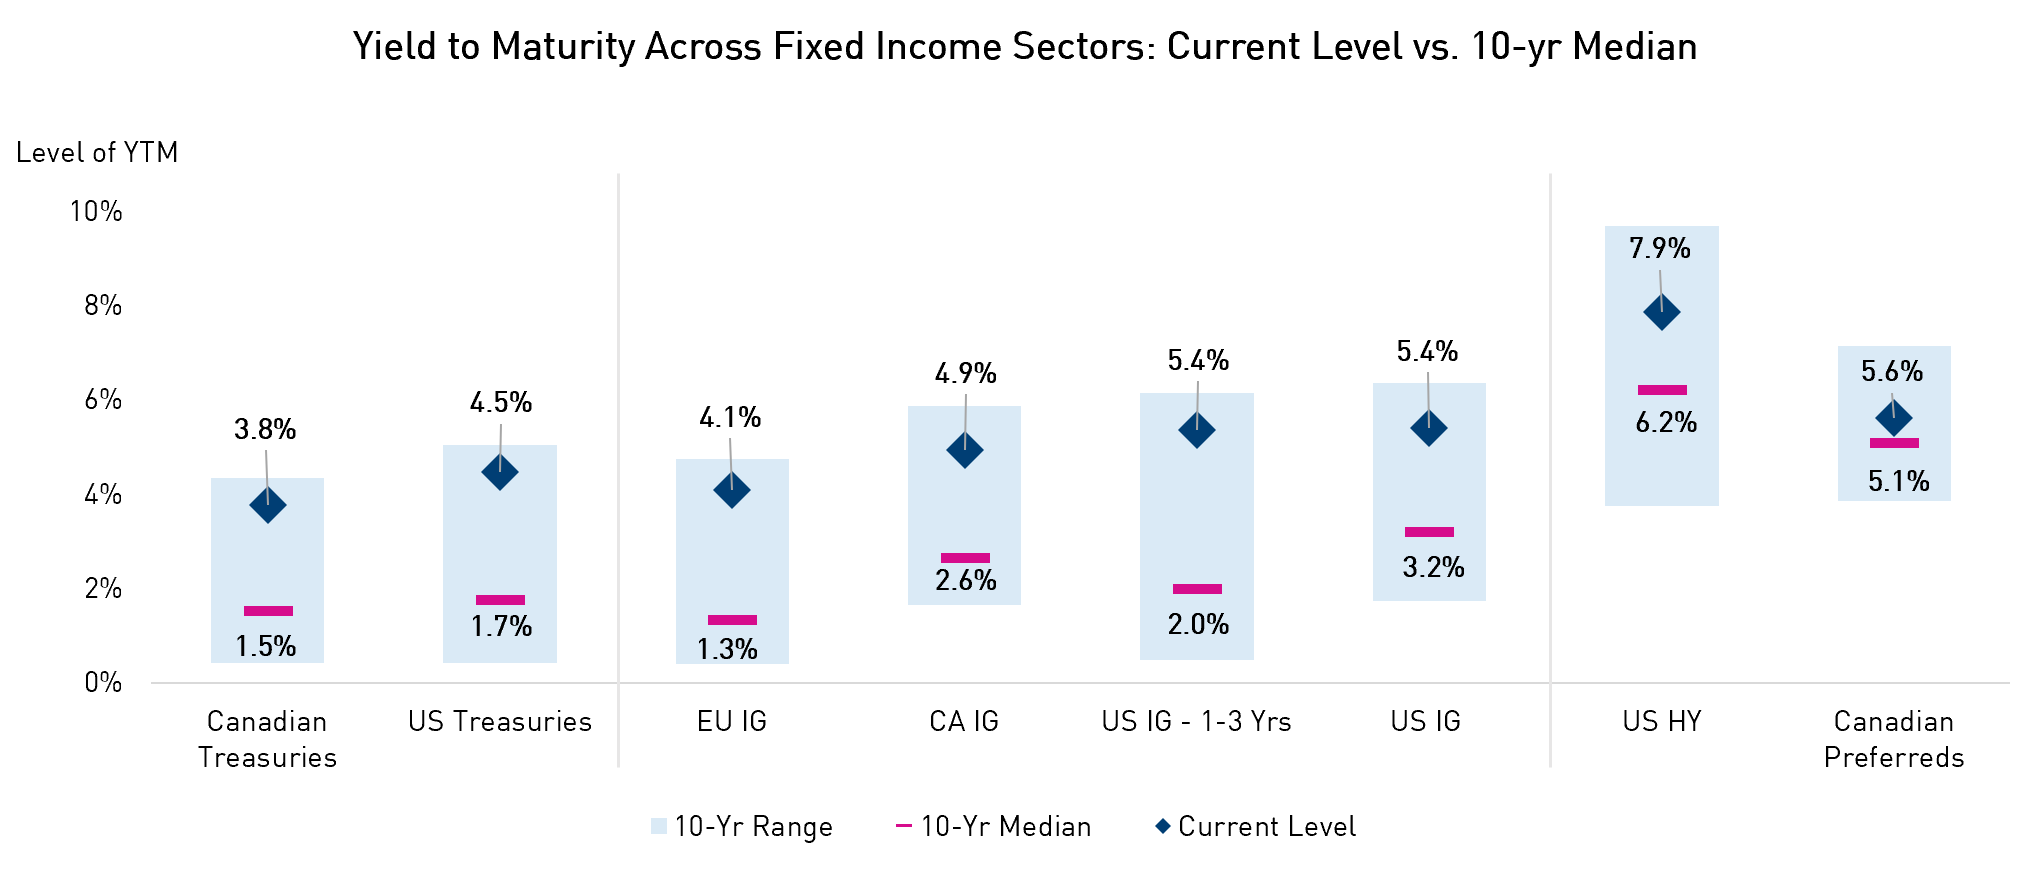
Source: BarclaysLive, YCharts. Data as of February 29, 2024. BMO Laddered Preferred Share Index ETF (ZPR) used as a proxy for Canadian Preferreds.
3. Despite Record High Bond Issuance in Q1, Negative Net Issuance Expected in the Following Quarters
Q1 saw abundant issuance in the U.S. market, primarily driven by refinancing needs and elevated M&A activity. Going forward, however, net issuance for Investment Grade rated corporate bonds is expected to turn negative for the rest of 2024. This means the volume of coupon maturities and payments is expected to be greater than the volume of new bonds issued. This, combined with strong inflows into fixed income, presents a bullish set-up for credit spreads.
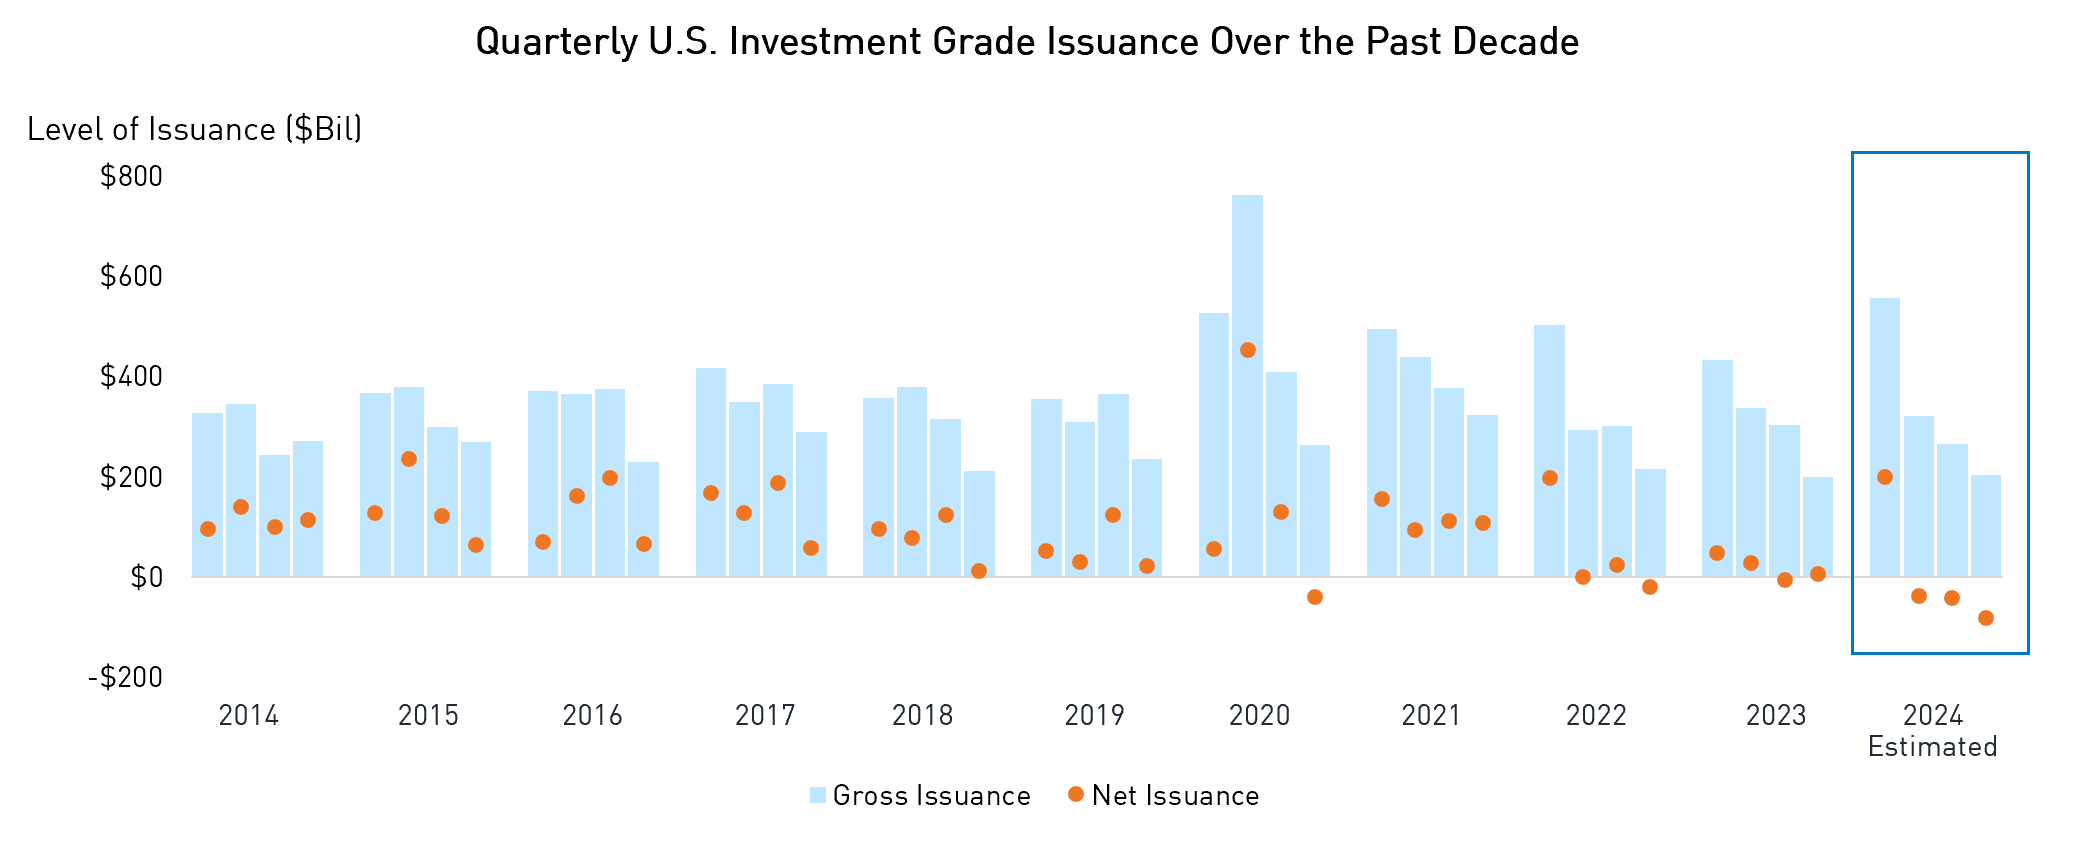
Source: BarclaysLive. Data as of March 31, 2024. Net issuance is calculated as gross issuance – redemption – coupon payments.
4. The Estimated Liquidity Premium for Private Credit Has Reduced Significantly Over the Last 24 Months
Today’s higher interest rate environment has diminished the estimated liquidity premium once offered by private debt to nearly nothing (by some estimates). Given this, we don’t believe investors should be locking up their capital in search of return as they can now achieve comparable expected returns by investing in more liquid, lower-risk asset classes. We believe actively managed public credit can strike the right balance, allowing you to obtain an attractive return without sacrificing liquidity or adding undue complexity.
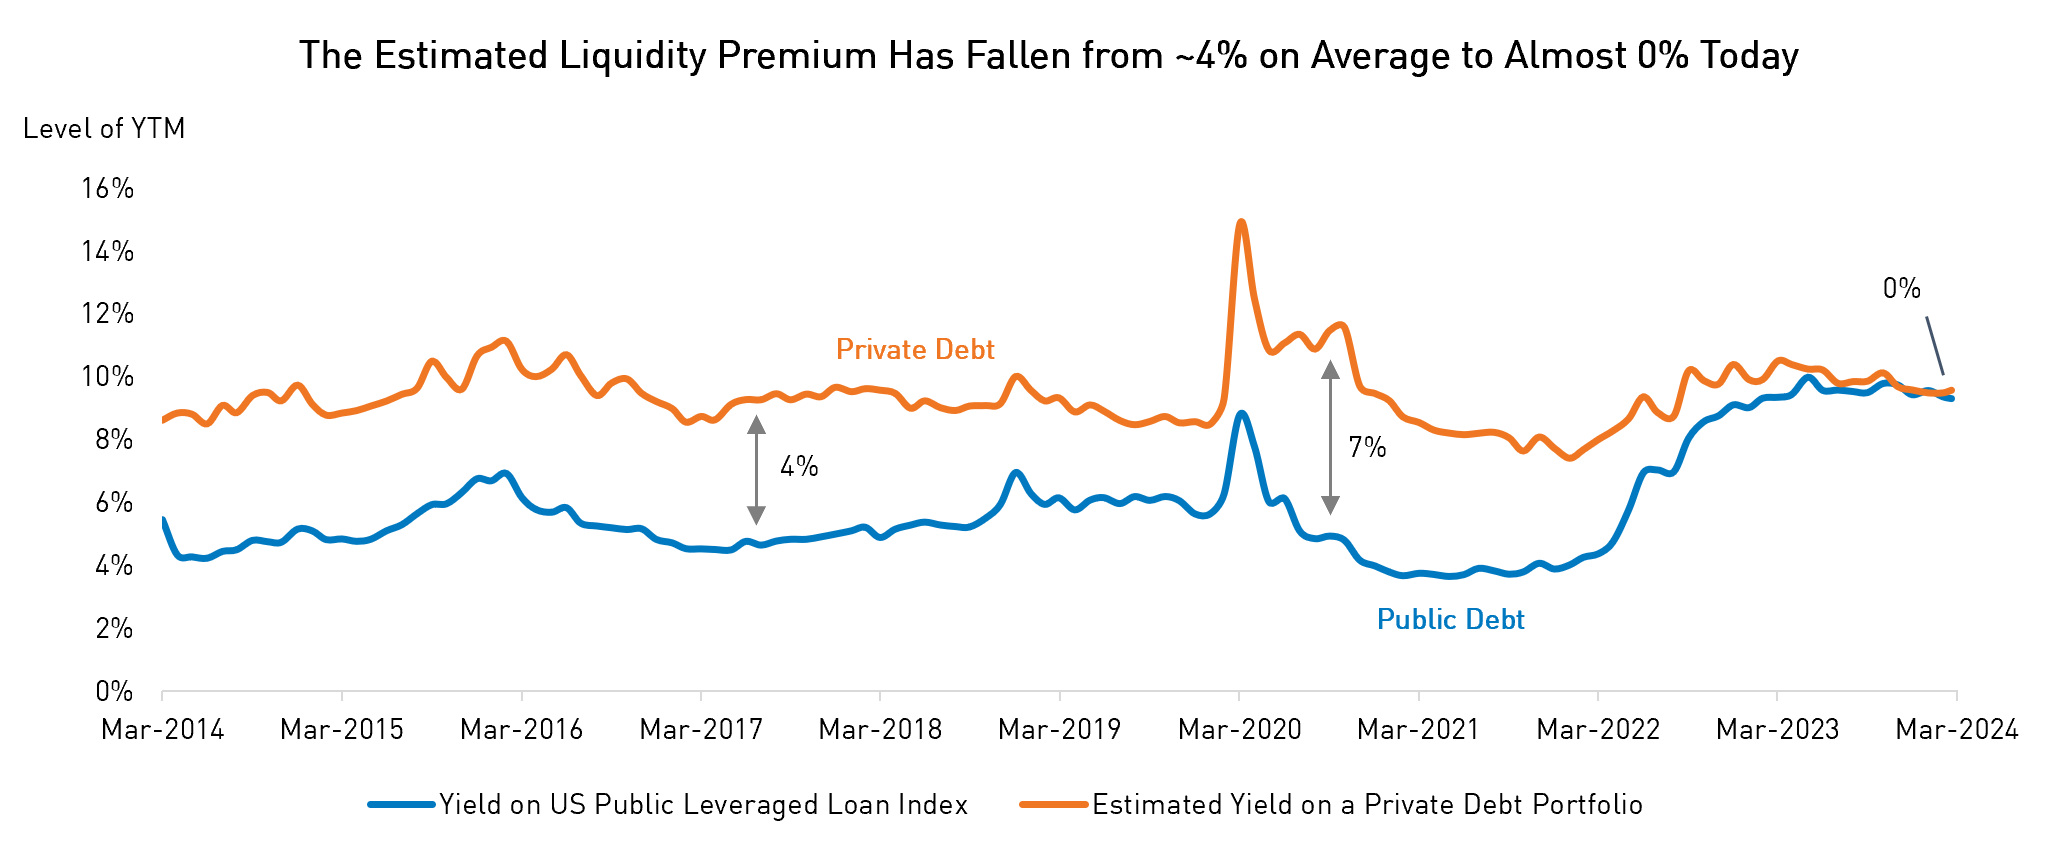
Source: Bloomberg, Morningstar LSTA. March 18, 2024. Estimated Yield on a Private Debt Portfolio is estimated by the dividend yield on the Ares (ARCC) BDC Portfolio. This chart compares the Net Dividend Indicated Yield and the Morningstar LSTA US Leveraged Loan 100 TR USD Yield to Maturity; the credit quality of the indices/portfolios will differ. For illustrative purposes only.
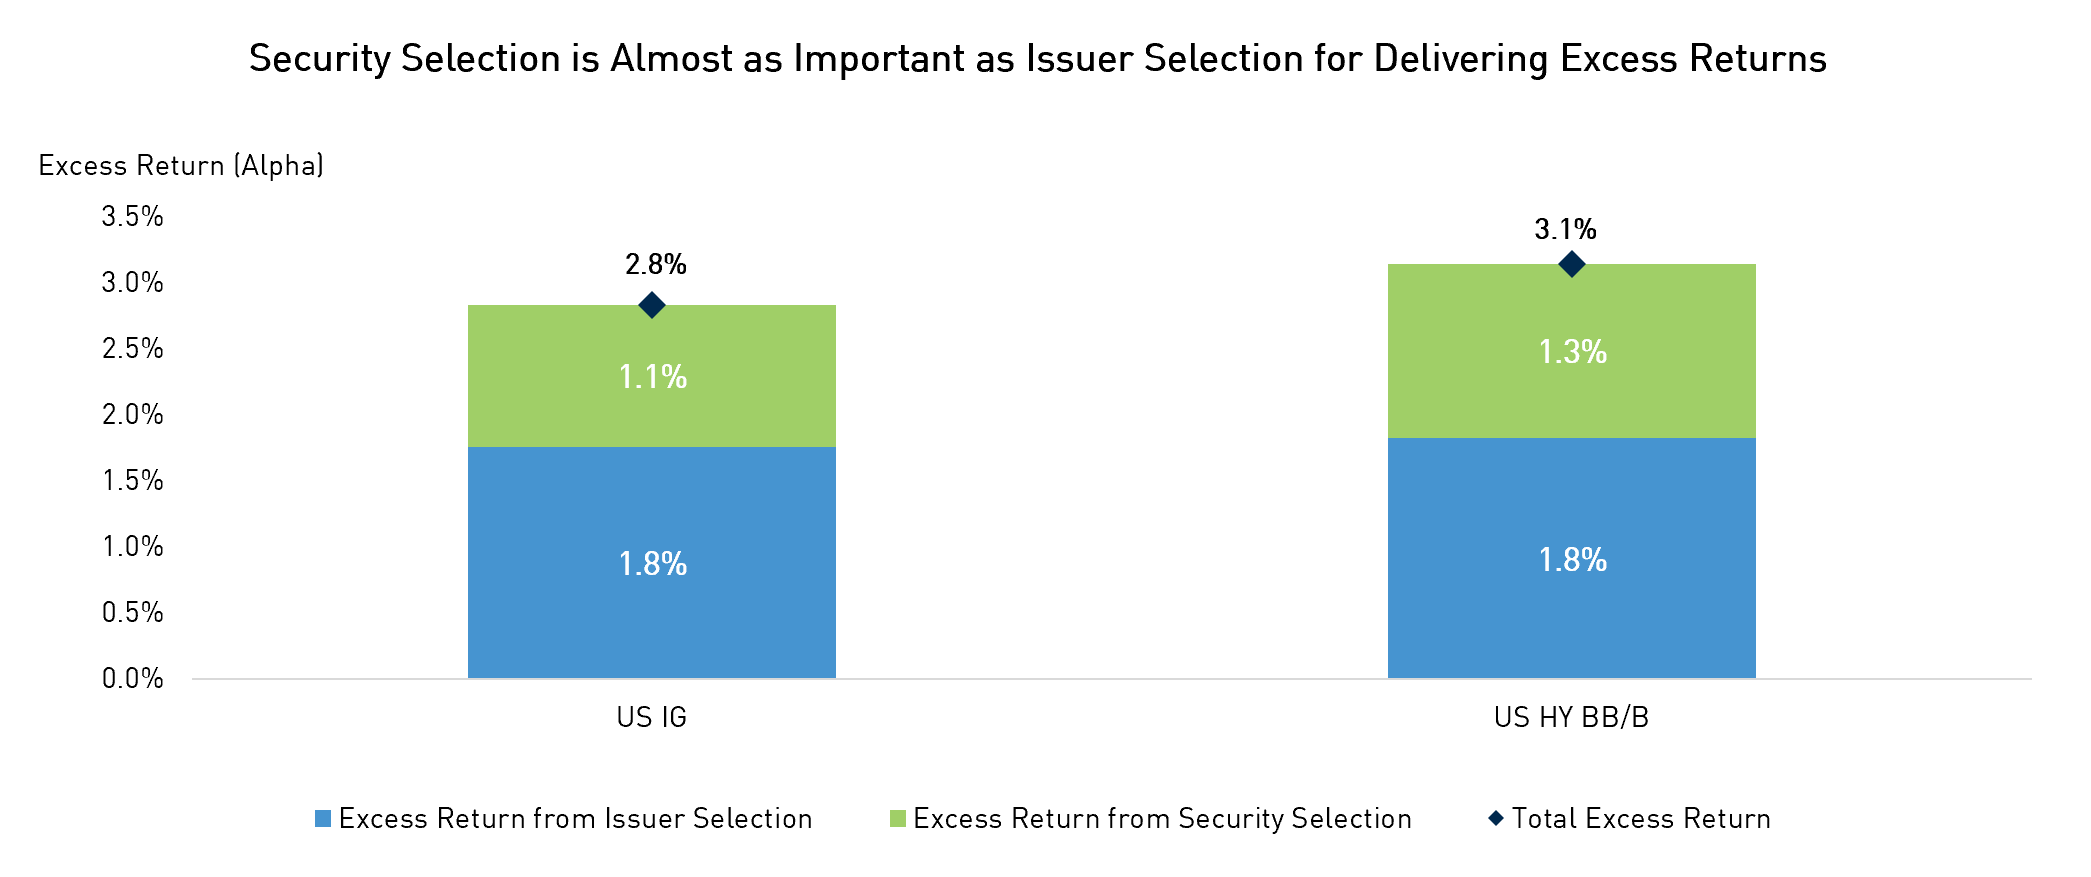
5. Issuer Selection is Only Half the Game, Issue Selection in Fixed Income Can Be Just as Important
A recent study by Barclays aimed to quantify the importance of bond (individual security) selection, separate from the issuer selection decision. Barclays used data from 2005 to 2023 to determine the impact of security selection on alpha generation (excess returns) across both Investment Grade and High Yield segments of the U.S. bond market.
The study found that alpha generated from bond selection contributed to ~40% of total alpha on average. This means it’s simply not enough to pick the right company – in order to optimize returns, it’s crucial to select the right securities within that company’s capital structure. A manager’s expertise in doing this can play a significant role in their ability to generate outperformance for their clients.
Source: Source: Bloomberg, BarclaysLive. Data as of February 5, 2024. Alpha numbers shown are per annum. The Systematic Value Credit Strategy above is a strategy designed by Barclays, which is rebalanced monthly by selecting bonds with above median “spread in relative value” (spread level unexplained by macro and fundamental characteristics) in the US Corporate IG/HY bond market. Alpha was measured by the difference in performance of top quintile portfolio (cheapest portfolios) and bottom quintile (most expensive portfolios).
Important Information
The information herein is presented by RP Investment Advisors LP (“RPIA”) and is for informational purposes only. It does not provide financial, legal, accounting, tax, investment, or other advice and should not be acted or relied upon in that regard without seeking the appropriate professional advice. The information is drawn from sources believed to be reliable, but the accuracy or completeness of the information is not guaranteed, nor in providing it does RPIA assume any responsibility or liability whatsoever. The information provided may be subject to change and RPIA does not undertake any obligation to communicate revisions or updates to the information presented. Unless otherwise stated, the source for all information is RPIA. The information presented does not form the basis of any offer or solicitation for the purchase or sale of securities. Products and services of RPIA are only available in jurisdictions where they may be lawfully offered and to investors who qualify under applicable regulation. RPIA managed strategies and funds carry the risk of financial loss. Performance is not guaranteed and past performance may not be repeated.
Commissions, trailing commissions, management fees and expenses all may be associated with mutual fund investments. Please read the prospectus before investing. Indicated rates of return include changes in share or unit value and reinvestment of all dividends or distributions and do not take into account sales, redemption, distribution or optional charges or income taxes payable by any securityholder that would have reduced returns. Returns for time periods of more than one year are historical annual compounded total returns while returns for time periods of one year or less are cumulative figures and are not annualized. Mutual funds are not guaranteed, their values change frequently and past performance may not be repeated. The compound growth chart is used only to illustrate the effects of a compound growth rate and is not intended to reflect future values or returns of the Fund.
The index performance comparisons presented are intended to illustrate the historical performance of the indicated strategies compared with that of the specified market index over the indicated period. The comparison is for illustrative purposes only and does not imply future performance. There are various differences between an index and an investment strategy or fund that could affect the performance and risk characteristics of each. Market indices are not directly investable and index performance does not account for fees, expense and taxes that might be applicable to an investment strategy or fund. “Forward-Looking” statements are based on assumptions made by RPIA regarding its opinion and investment strategies in certain market conditions and are subject to a number of mitigating factors. Economic and market conditions may change, which may materially impact actual future events and as a result RPIA’s views, the success of RPIA’s intended strategies as well as its actual course of conduct.
-
 The Wind at Our BacksNotes from the Trading Desk - Q1 2024Slowing issuance, combined with the high inflows into fixed income, lends for a significant tailwind where investors can take advantage of the compelling opportunities in active credit.Read post
 -
 What's liquidity worth to you?Letter from the CEOOur CEO discusses the recent challenges in the private debt space and how they have changed the way investors evaluate liquidity and transparency within their portfolios.Read post