Q2 2025 extended the trend of heightened volatility across asset classes, and these five charts highlight what we see as some of the key themes and opportunities in the current market environment. Please feel free to contact us if you would like to discuss these themes further or learn more about how we could help you meet your investment objectives.
1. We Expect the Divergence Between Hard and Soft Data to Close in H2 as the US Economy Weakens
Since the “Liberation Day” tariffs announcement on April 2nd, there has been a marked divergence in “soft” data (confidence indicators and survey data) and “hard” data (inflation, jobs, growth). The soft data reflects a sharp drop in consumer confidence, while the hard data points to an economy that is still performing well. Previous growth slowdowns have also experienced a divergence, but typically not to this degree. We believe the hard data will start to weaken in the second half of the year. With this in mind, we continue to position our portfolios conservatively.
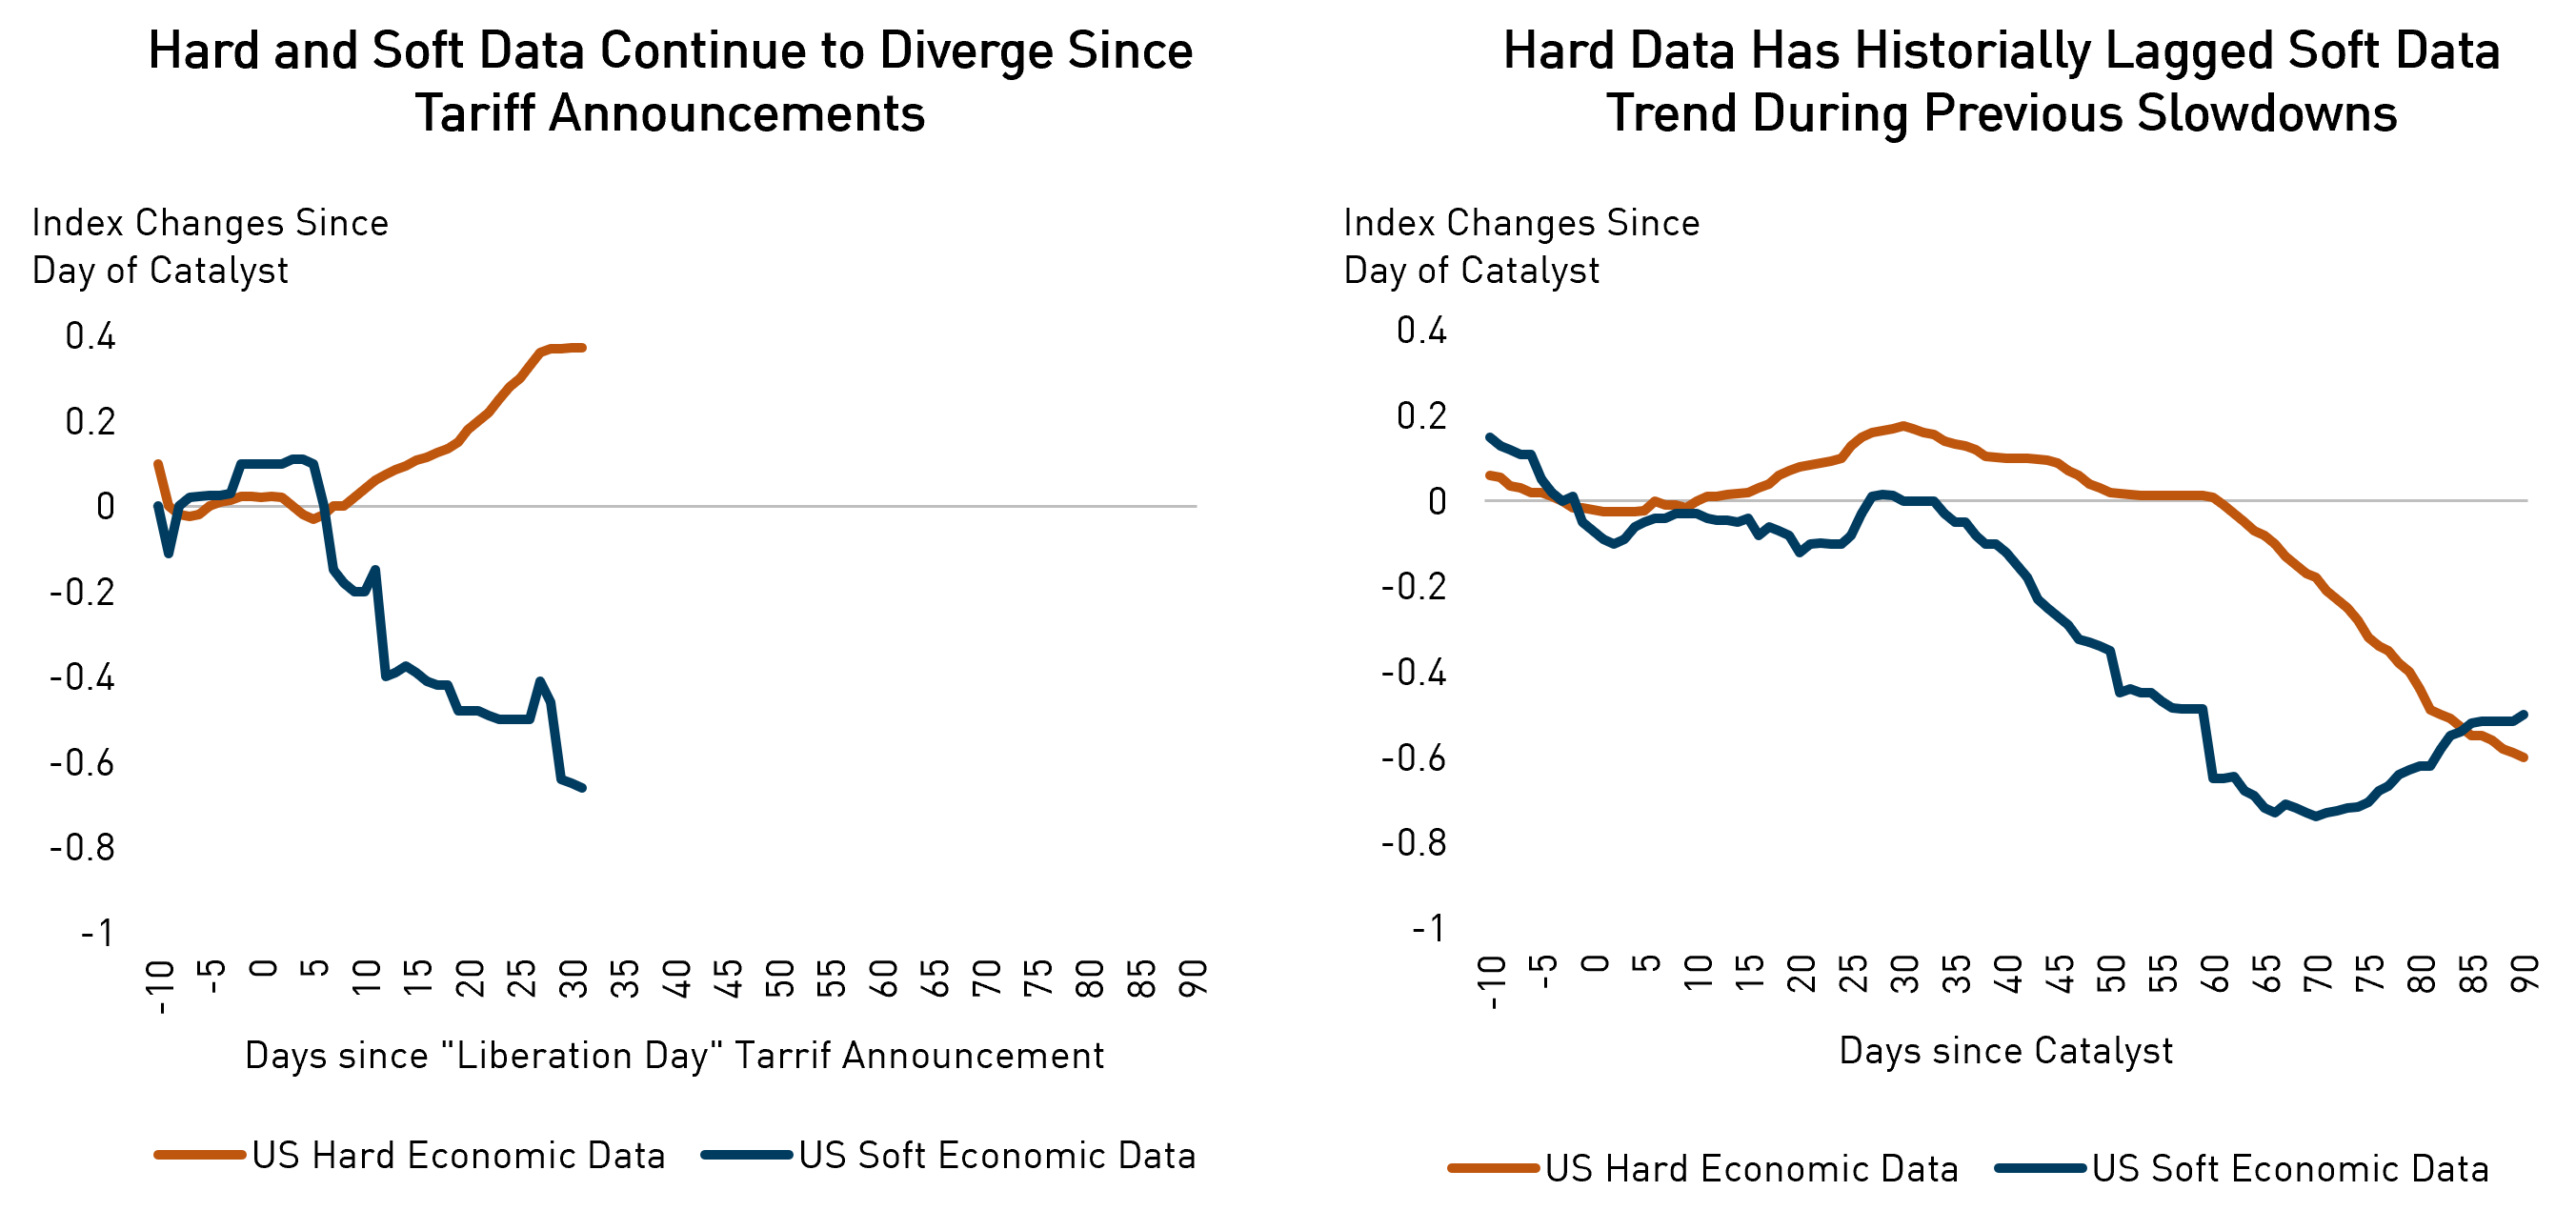
Source: Goldman Sachs Investment Research. Data as of May 06, 2025. *Previous even-driven growth slowdowns include the 1973 oil spike, the 1979-1980 Volcker interest rate increases, the 1990 oil spike around the invasion of Kuwait, and the 2001 dot-com crash. These events were picked because Goldman could identify a relatively clear catalyst that started, accelerated, or worsened the recession.
2. Structural Changes in the US Credit Market Have Resulted in Improved Market Liquidity
Over the past decade, the share of US corporate bonds that trade on a daily basis has increased from around 70% to more than 90%. This improvement has been supported by structural changes in the credit market, particularly the rise of ETFs and portfolio trading (i.e., basket trades), and is an indication of enhanced liquidity and improved market depth. Portfolio trades, which barely existed seven years ago, have grown rapidly in trade volume and now account for approximately 20% of monthly trading volume in the US bond market. It will be interesting to see how market liquidity changes in future periods of volatility.
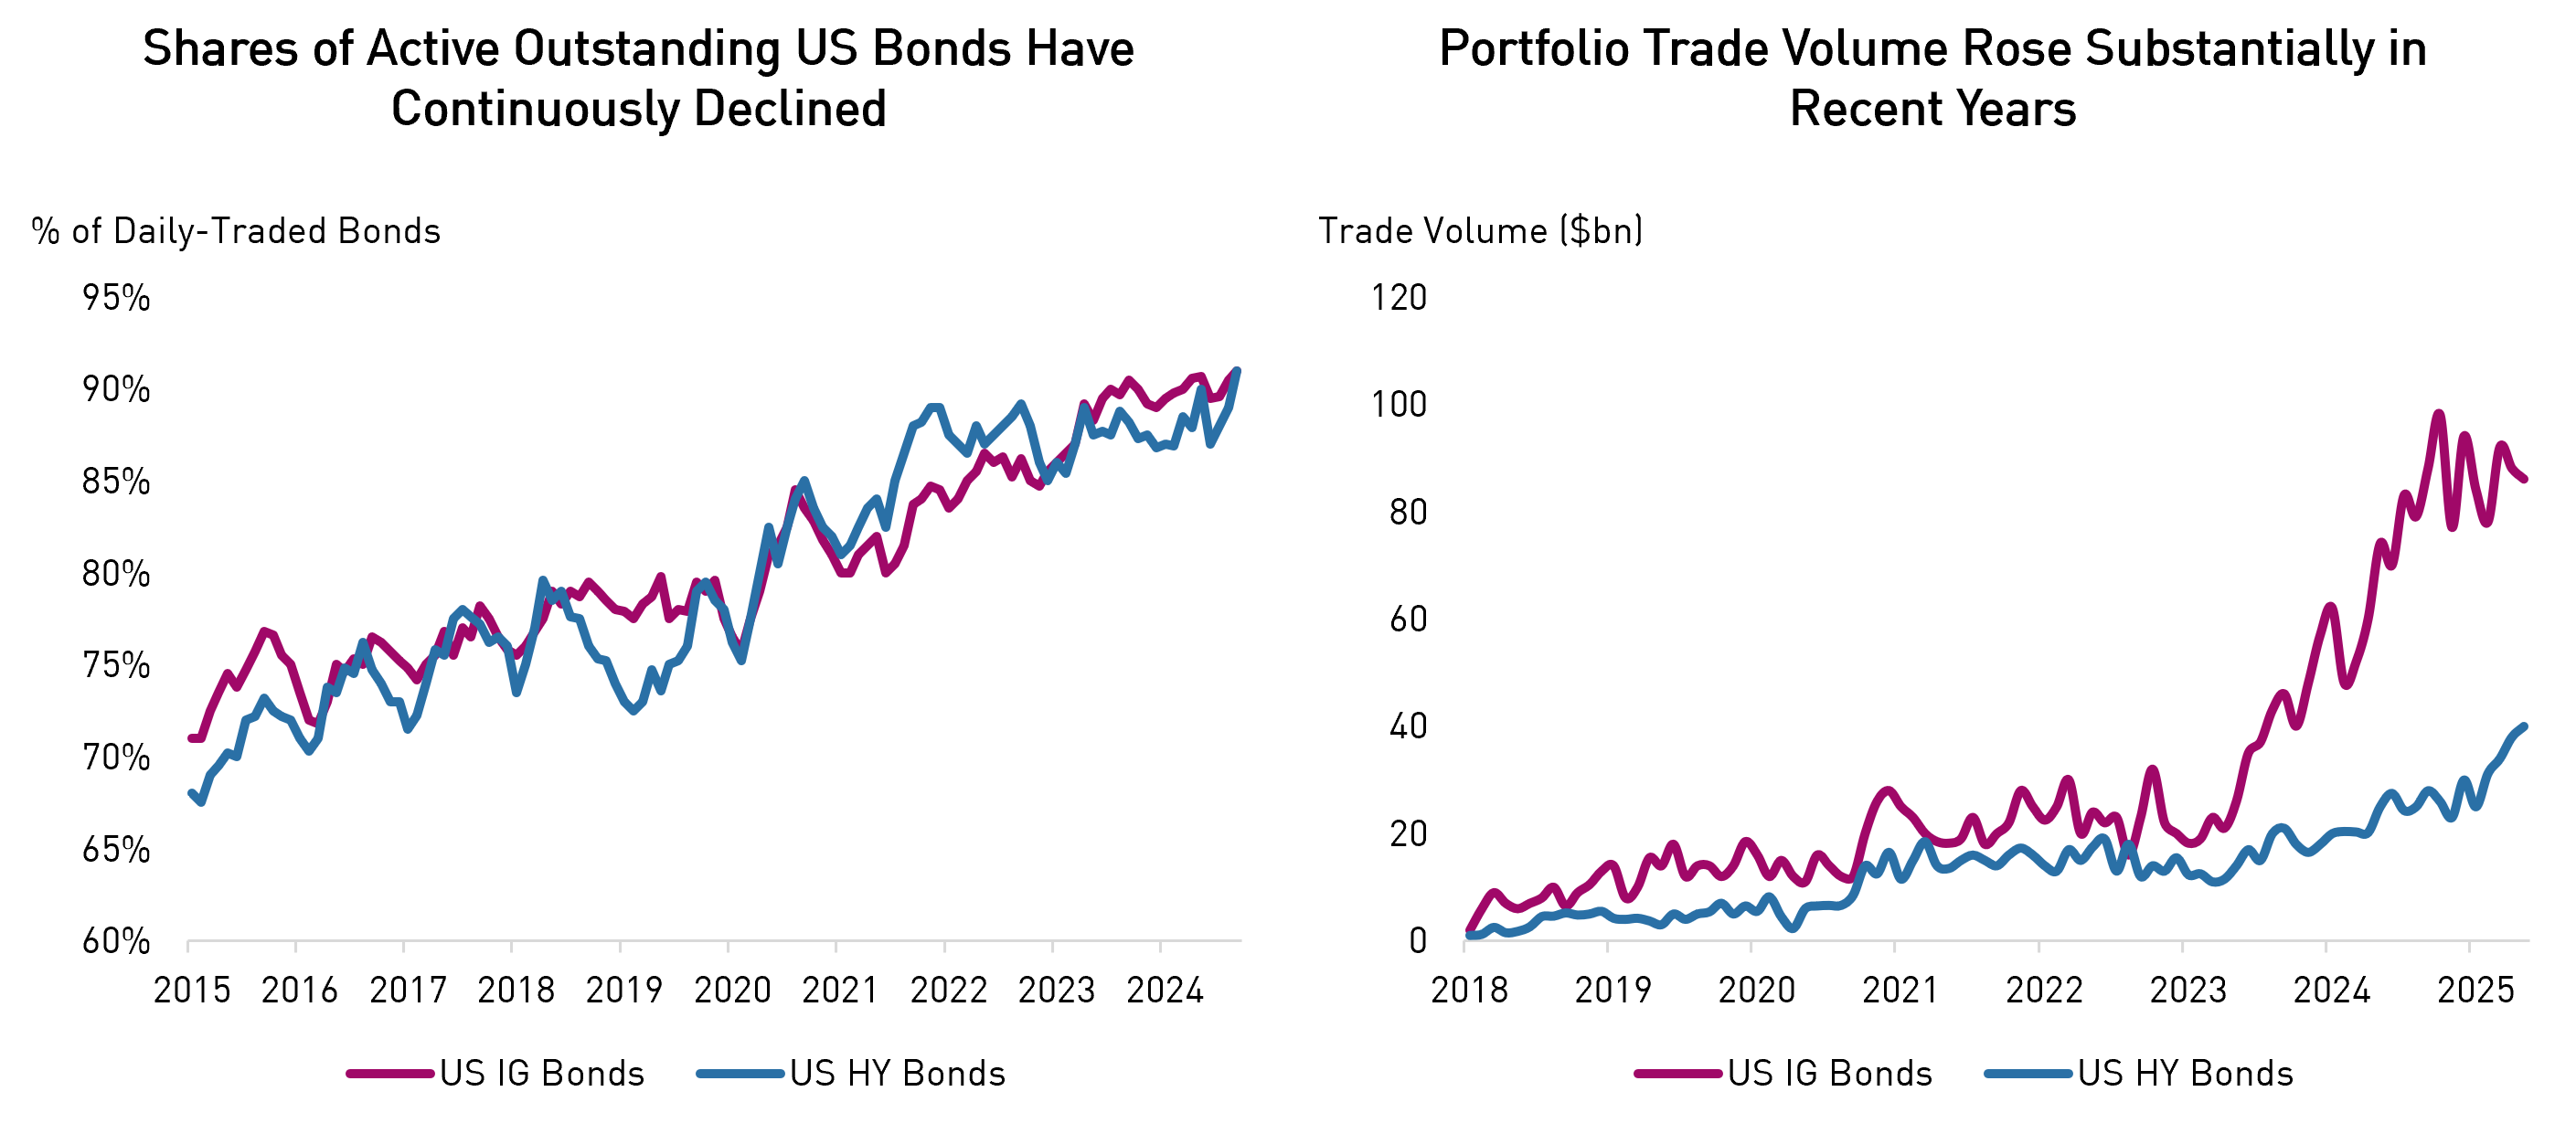
Source: BarclaysLive, Bloomberg. Data as of May 30, 2025. US corporate bonds refer to bonds included in the Bloomberg Barclays US Investment Grade Index and Bloomberg Barclays US High Yield Index.
3. We Believe Corporate Bonds Can Provide Investors With Elevated Yields and Contribute to Portfolio Stability
Since President Trump assumed office earlier this year, policy has become more unpredictable – and in the early part of Q2, we saw a sharp increase in market volatility. During that same period, the daily return volatility of corporate bonds has been more stable at approximately one-fourth that of equities. Credit spreads this year have been relatively stable, with daily return volatility one-seventh that of the equity market. Also of note is the fact that the yield on corporate bonds is still higher than the equity earnings yield – despite credit spreads being relatively tight by historical standards. Taken together, we think this speaks to the attractiveness of corporate bonds at the current time, particularly given the prospect of more volatility and economic weakness ahead.
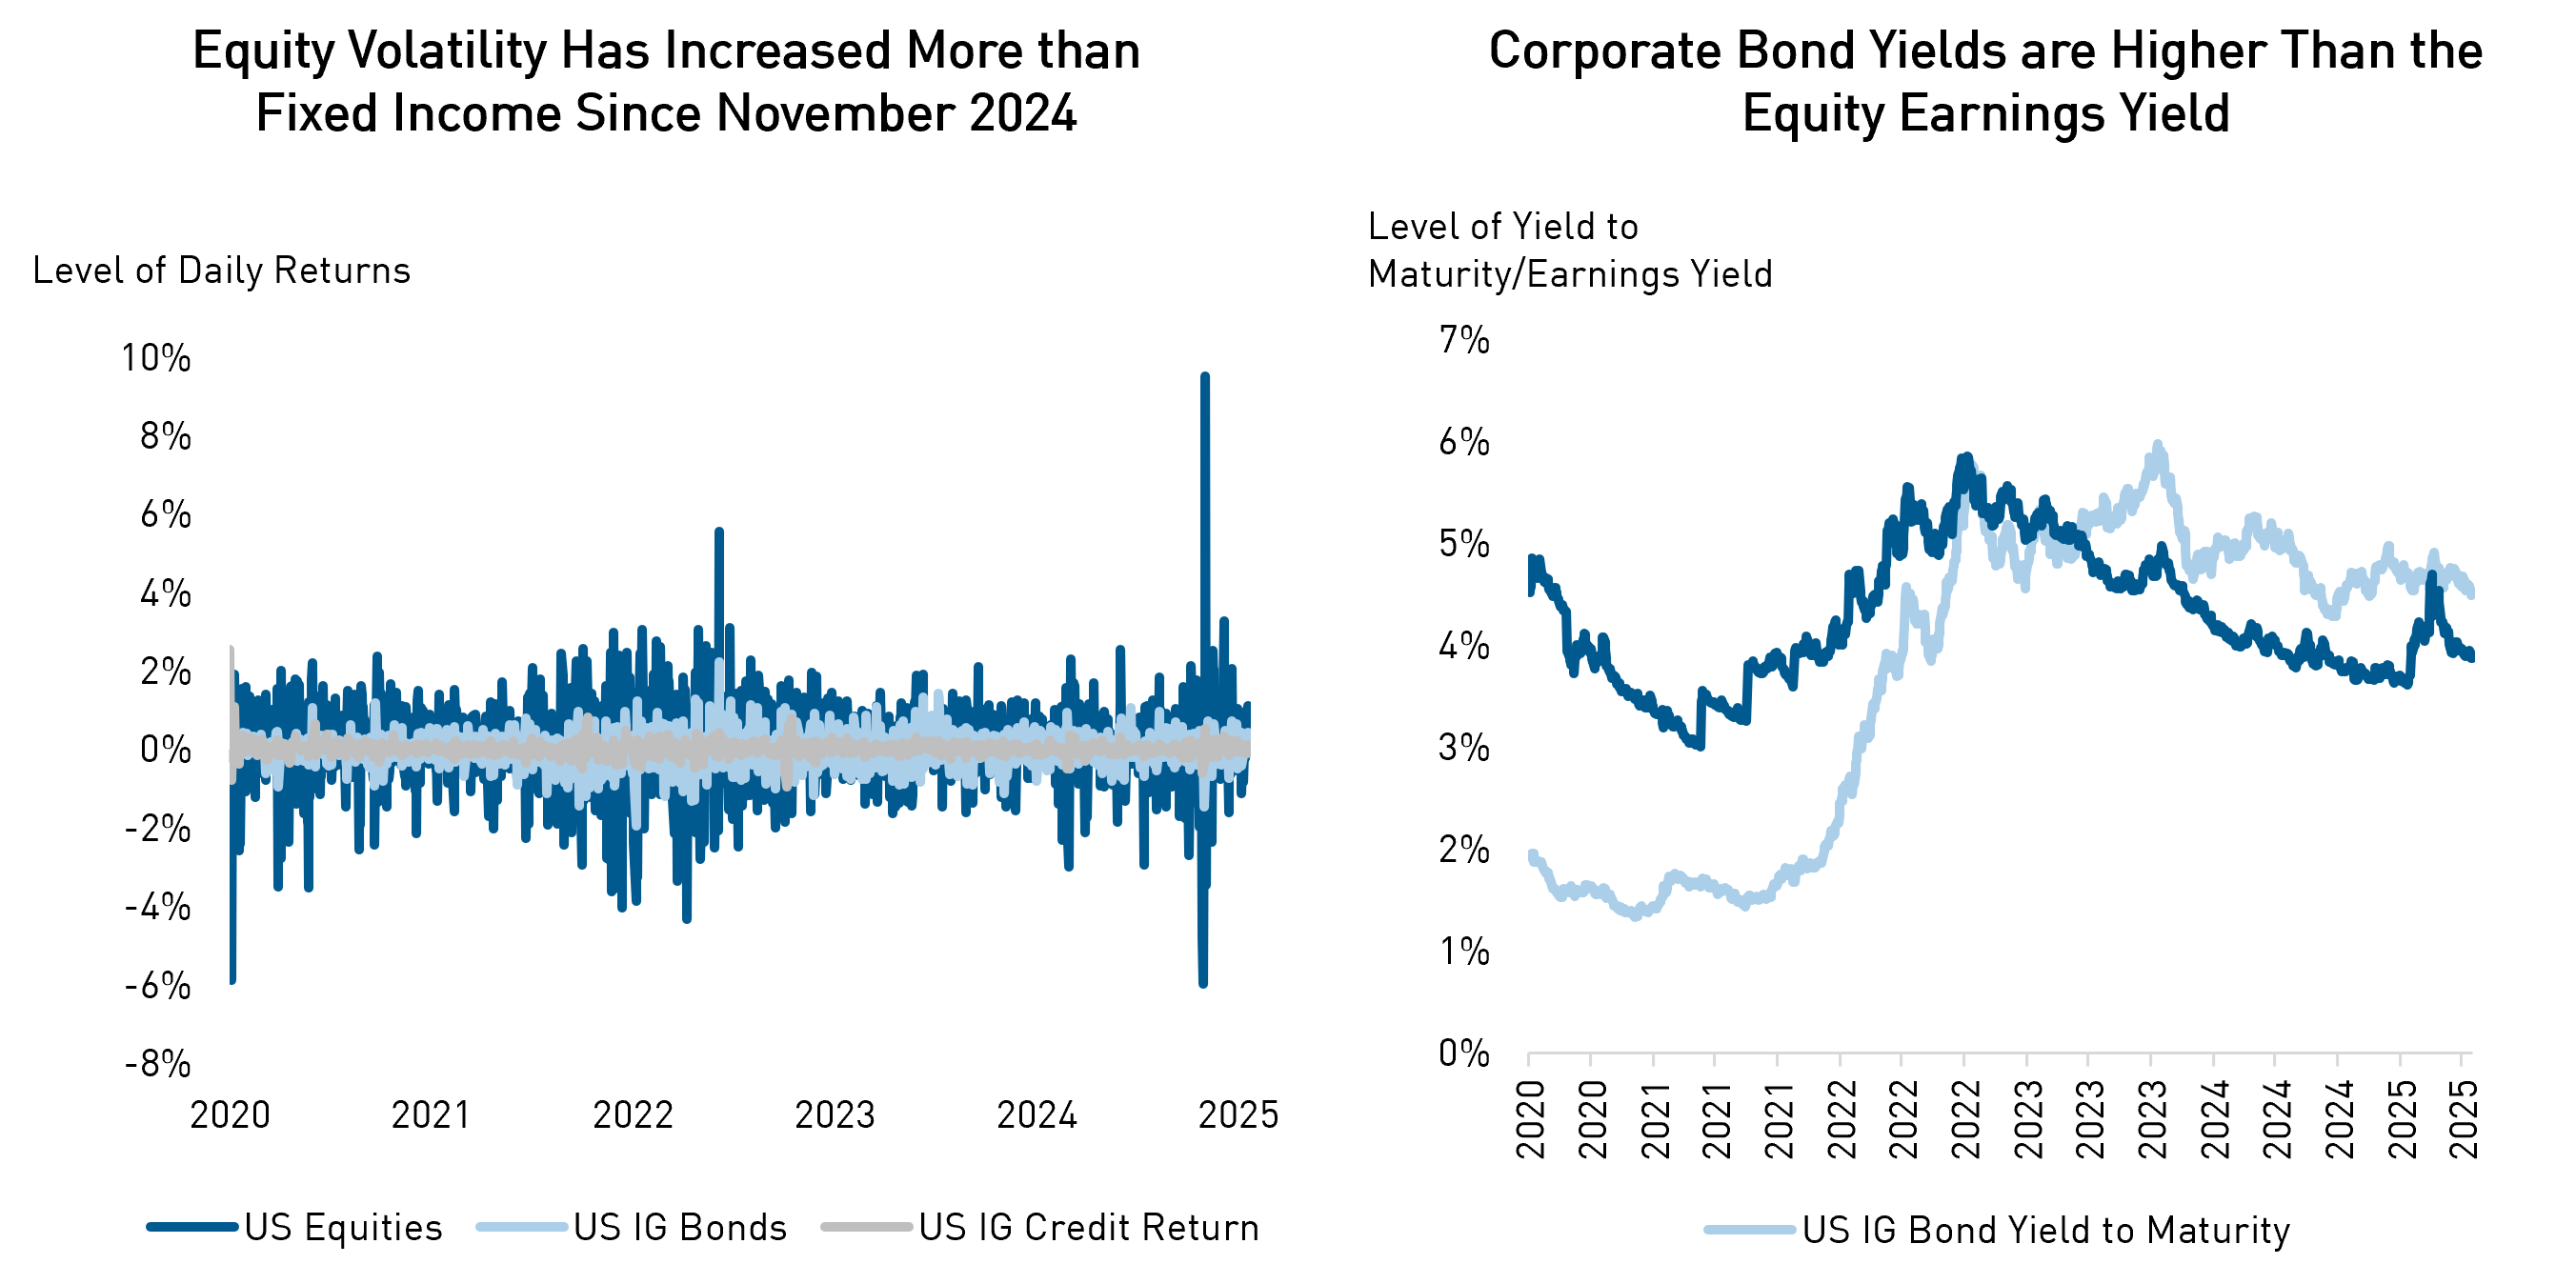
Source: BarclaysLive. US equities = S&P500, US IG Bonds = Bloomberg Barclays US Corporate Bond Index, US IG Credit return = Bloomberg Barclays US Corporate Bond Index Excess Return. Date as of June 24, 2025.
4. Yield and Spreads Have Been Negatively Correlated – Meaning Credit Exposure Has Been Dampening Volatility From Moves in Yields
Over the last few years, risk-free rates have increased significantly while credit spreads have declined. While the correlation between rates and credit spreads has varied over time, we believe a negative correlation coefficient is more typical. This is because higher yields generally mean institutional investors adding more to their fixed income allocations, which can serve to compress spreads – and vice versa. However, historically, there have been several periods during which this relationship has not held. For example, in 2022, interest rates rose in response to inflationary pressures, while credit spreads widened as the outlook for corporate earnings deteriorated. Going forward, we continue to expect that significant moves lower in yields will probably be reflected in wider spreads, while higher yields should be supportive (better) for credit spreads.
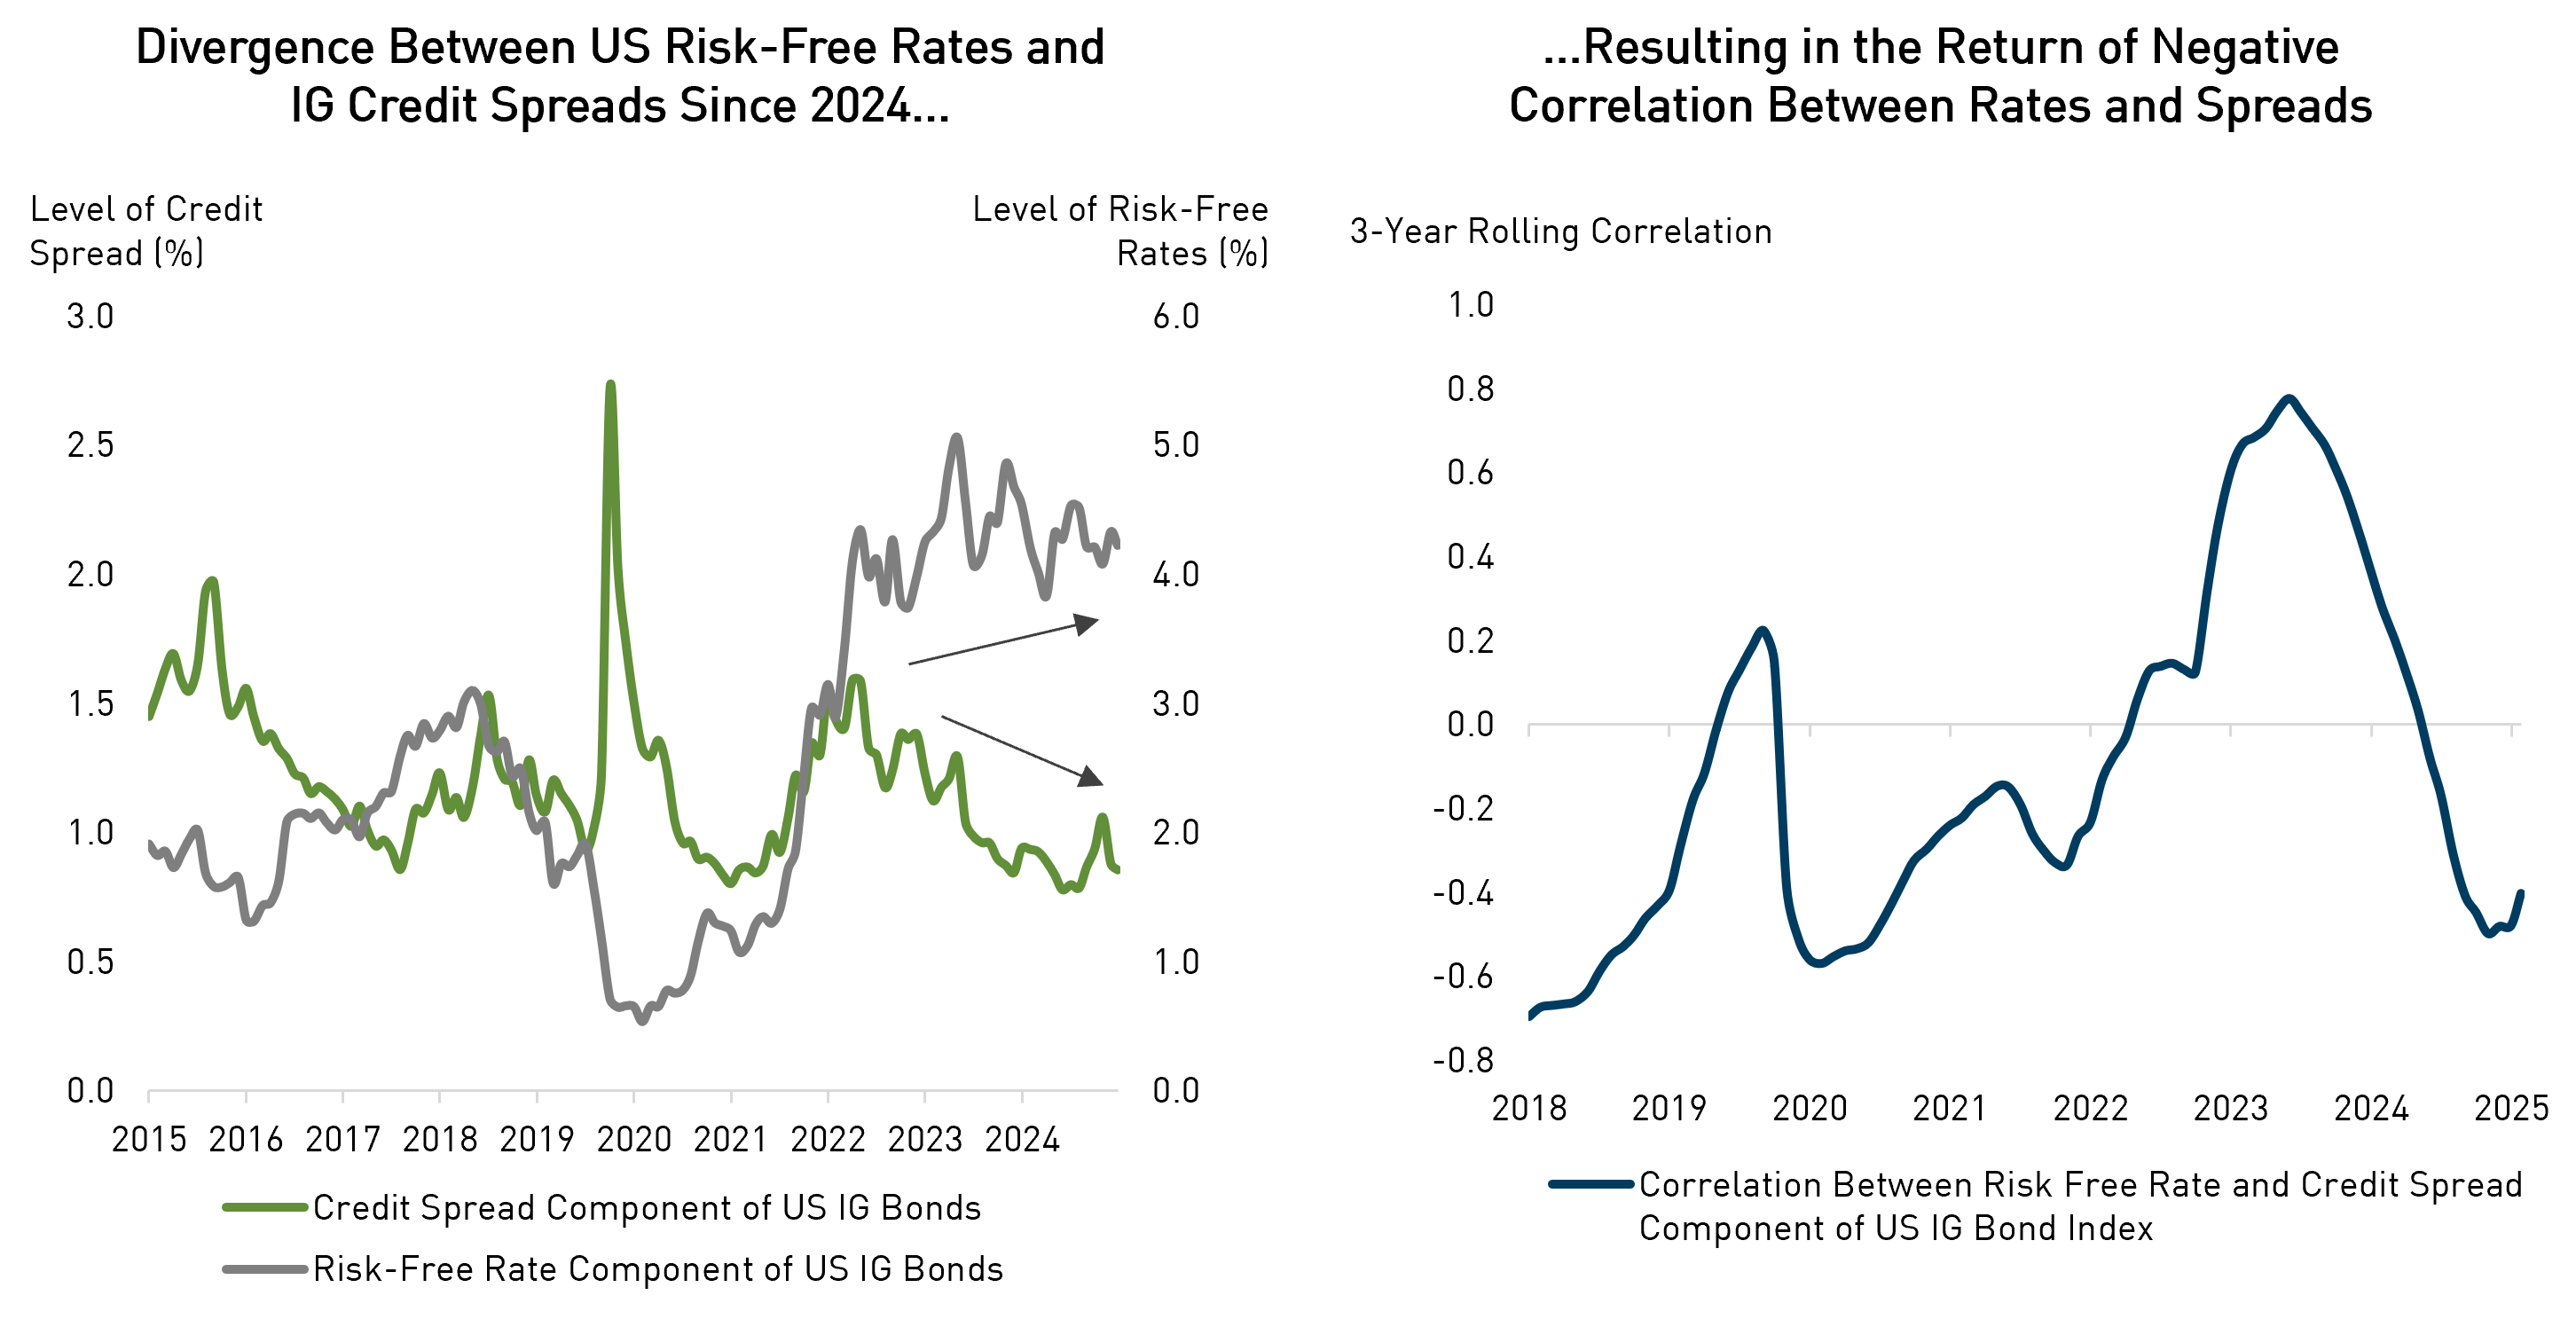
Source: Bloomberg. Data as of June 25, 2025. Correlation is calculated on a daily and three-year rolling basis.
5. Private Credit Increasingly Overlaps With Public Credit, Making Its Liquidity Premium Harder to Justify
There used to be a fairly clean separation between public credit investors and private credit investors – with private credit investors generally making loans to borrowers that didn’t “fit” the public market. For example, the borrowers may have been smaller in size or high growth, but pre-revenue, etc. Generally speaking, larger, more mature borrowers accessed the public markets while smaller, more leveraged borrowers went down the private route. However, the line between public and private credit has blurred in recent years. Many corporate borrowers access both markets for financing. As the chart below shows, private lending firms have increasingly grown their presence in Middle Market loan issuance, today accounting for around 90% of that issuance. This speaks to the fact that private debt firms are now having to move beyond their original area of focus as the volume of assets into private funds has grown.
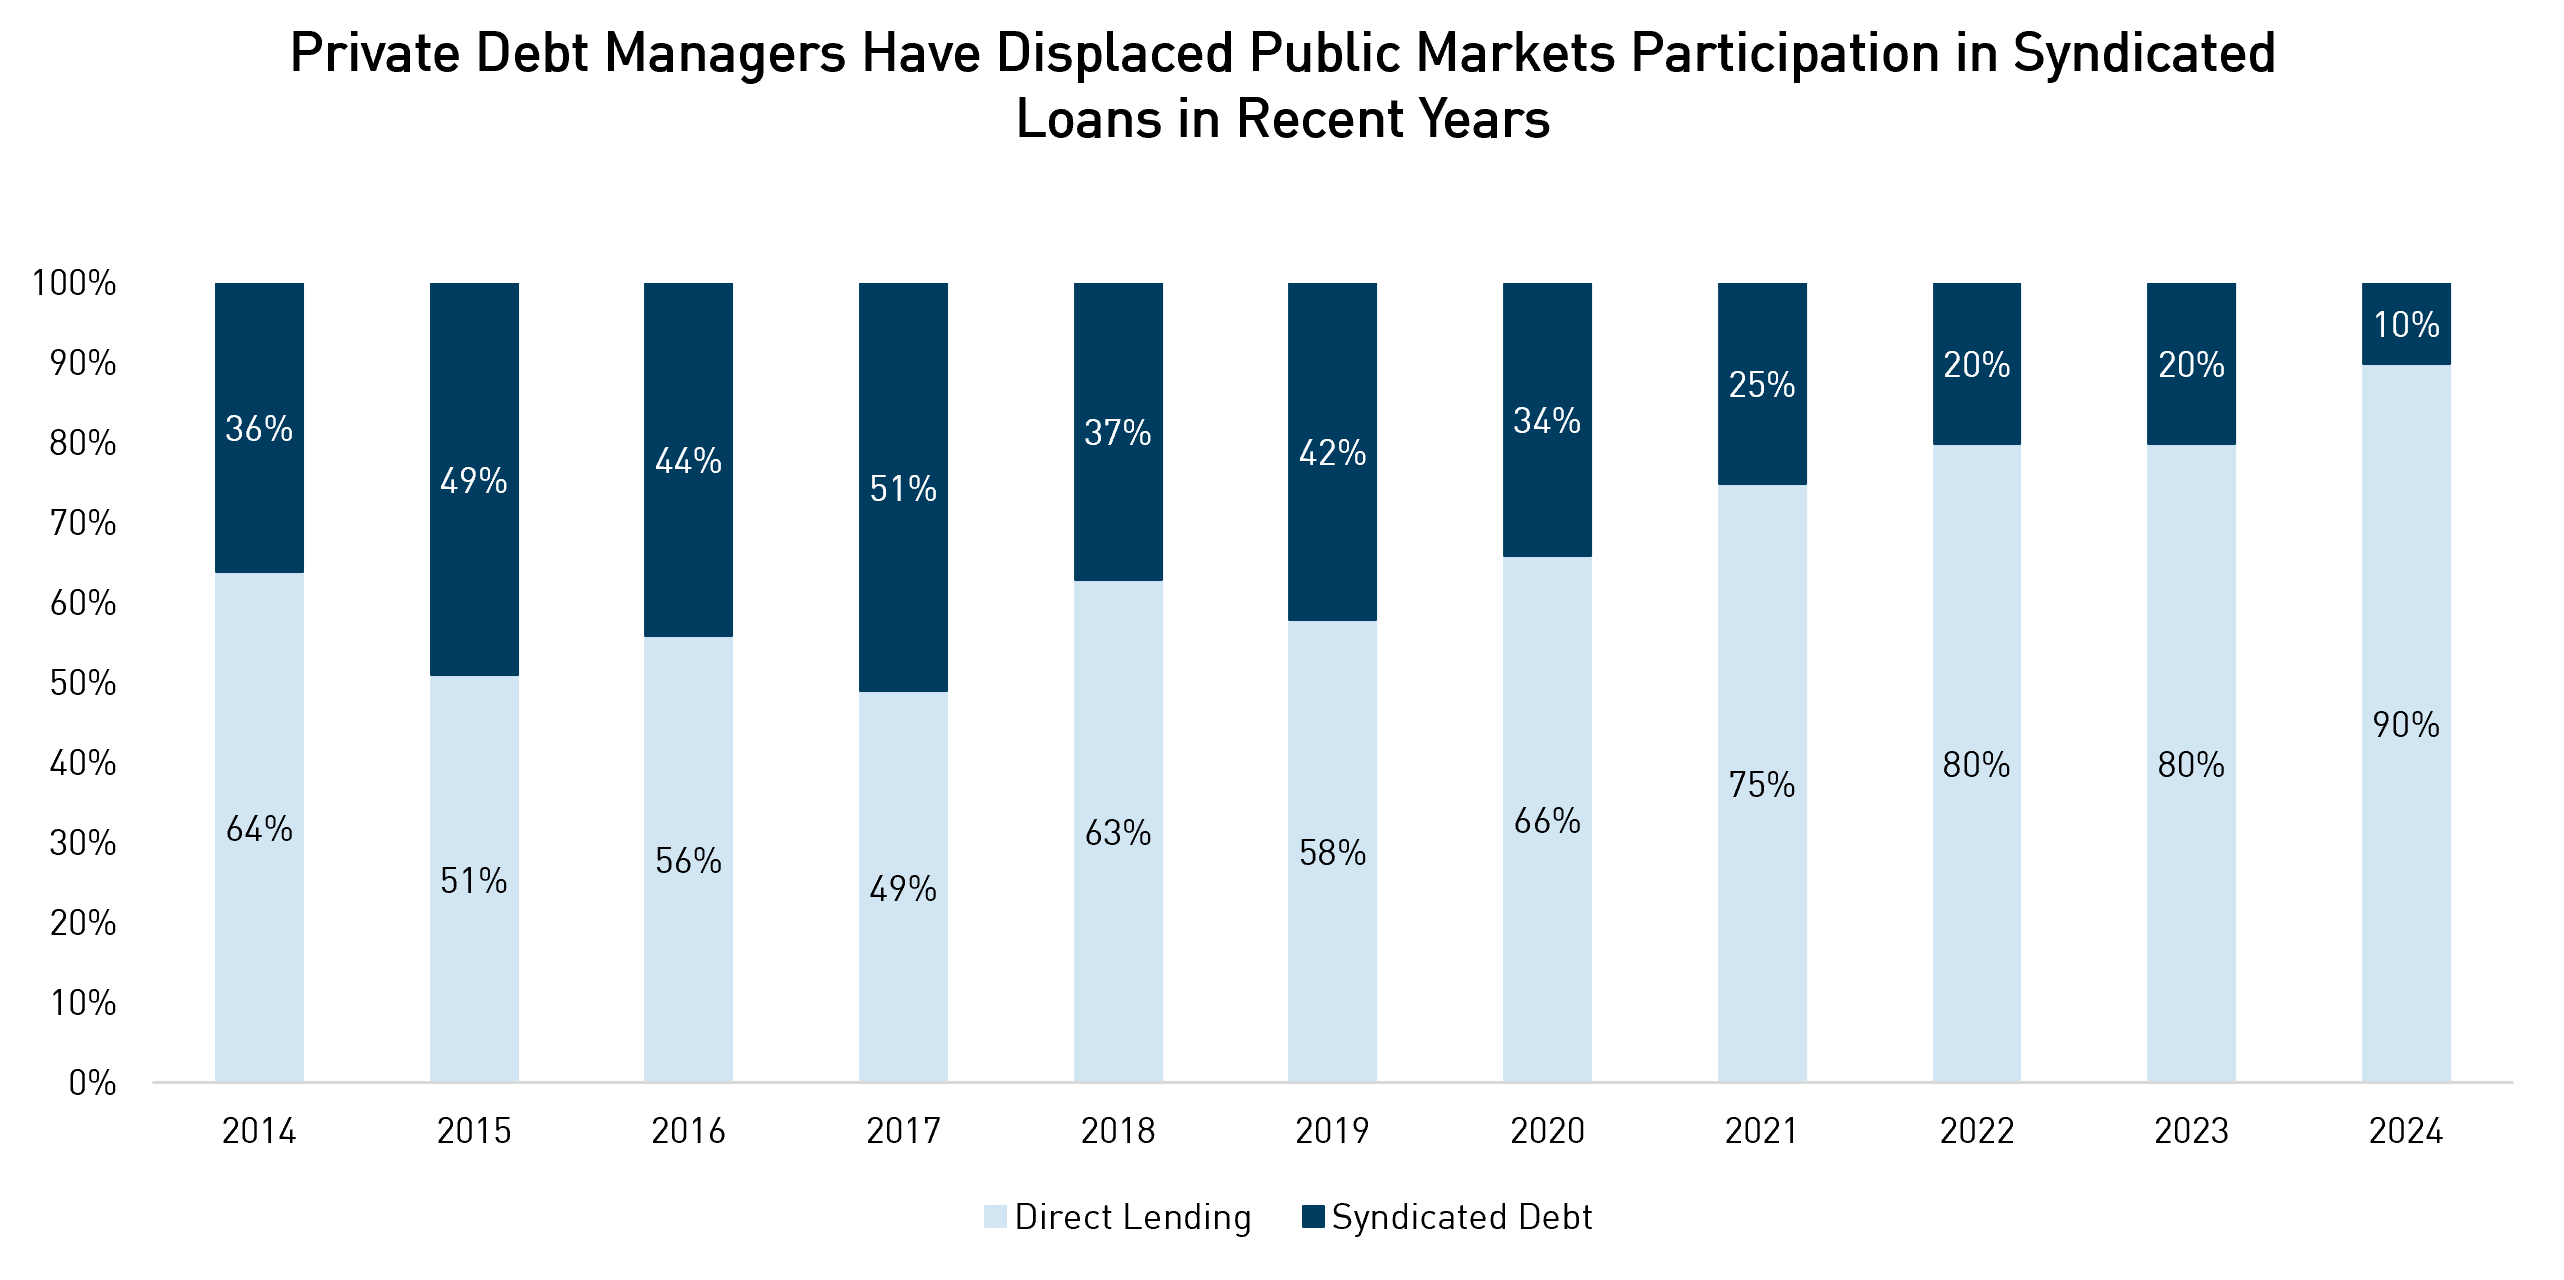
Source: LSEG. Data as of December 31, 2024. Middle market includes issuers with revenue < $500 million.
Important Information
The information herein is presented by RP Investment Advisors LP (“RPIA”) and is for informational purposes only. It does not provide financial, legal, accounting, tax, investment, or other advice and should not be acted or relied upon in that regard without seeking the appropriate professional advice. The information is drawn from sources believed to be reliable, but the accuracy or completeness of the information is not guaranteed, nor in providing it does RPIA assume any responsibility or liability whatsoever. The information provided may be subject to change and RPIA does not undertake any obligation to communicate revisions or updates to the information presented. Unless otherwise stated, the source for all information is RPIA. The information presented does not form the basis of any offer or solicitation for the purchase or sale of securities. Products and services of RPIA are only available in jurisdictions where they may be lawfully offered and to investors who qualify under applicable regulation. RPIA managed strategies and funds carry the risk of financial loss. Performance is not guaranteed and past performance may not be repeated.
Commissions, trailing commissions, management fees and expenses all may be associated with mutual fund investments. Please read the prospectus before investing. Indicated rates of return include changes in share or unit value and reinvestment of all dividends or distributions and do not take into account sales, redemption, distribution or optional charges or income taxes payable by any securityholder that would have reduced returns. Returns for time periods of more than one year are historical annual compounded total returns while returns for time periods of one year or less are cumulative figures and are not annualized. Mutual funds are not guaranteed, their values change frequently and past performance may not be repeated. The compound growth chart is used only to illustrate the effects of a compound growth rate and is not intended to reflect future values or returns of the Fund.
The index performance comparisons presented are intended to illustrate the historical performance of the indicated strategies compared with that of the specified market index over the indicated period. The comparison is for illustrative purposes only and does not imply future performance. There are various differences between an index and an investment strategy or fund that could affect the performance and risk characteristics of each. Market indices are not directly investable and index performance does not account for fees, expense and taxes that might be applicable to an investment strategy or fund. “Forward-Looking” statements are based on assumptions made by RPIA regarding its opinion and investment strategies in certain market conditions and are subject to a number of mitigating factors. Economic and market conditions may change, which may materially impact actual future events and as a result RPIA’s views, the success of RPIA’s intended strategies as well as its actual course of conduct.


