
Market Commentary
While most bond indices and funds posted modest positive returns during Q1, fixed income markets were volatile as investors continued to assess the likely path of central bank policy. Currently, markets have priced in 3-4 rate cuts in the U.S. and Canada for 2024. However, there continues to be a wide spectrum of opinions – ranging from “no cuts at all” to 5+ cuts. Taken together, yields increased modestly in Q1, although this was partially offset by credit spreads tightening. The market continues to be ripe for active management with plenty of pricing dislocations and relative value opportunities around new issuance.
RP Fixed Income Plus
| 1 MON | 3 MON | YTD | 1 YR | 3 YR | 5 YR | Since Inception | |
|---|---|---|---|---|---|---|---|
| RP Fixed Income Plus |
0.46%
|
0.32%
|
0.32%
|
4.59%
|
1.68%
|
2.00%
|
3.44%
|
| FTSE Canada Universe Short-Term Bond Index |
0.47%
|
0.32%
|
0.32%
|
3.48%
|
0.25%
|
1.34%
|
1.97%
|
| Added Value |
-0.01%
|
0.00%
|
0.00%
|
1.11%
|
1.43%
|
0.66%
|
1.47%
|
Source: RPIA. FTSE Russell. Data as of 03/31/2024 and annualized for periods greater than one year. SI = 07/2010. RP Fixed Income Plus strategy performance presented above represents a weighted-average composite return of separately managed accounts utilizing a similar strategy from inception in July 2010 to April 2013 and linked to the returns of the RP Fixed Income Plus Fund, Series A thereafter.
FIP returned +0.32% during the quarter, performing in line with the FTSE Canada Universe Short-Term Bond Index (the “Index”).
The Strategy produced returns from credit spread exposure, while interest rate exposure modestly weighed on total performance. Credit returns were driven by financial-related issuers, including global/domestic systematically important banks, and energy-infrastructure issuers, primarily Canadian multinational pipeline companies.
| Top Contributors to Credit Return (Sector) |
|---|
| Financials |
| Energy |
| Real Estate |
Source: RPIA. Data as of 03/31/2024.
| Top Contributors to Credit Return (Issuer) |
|---|
| H&R Real Estate Investment Trust |
| Royal Bank of Canada |
| Enbridge Inc. |
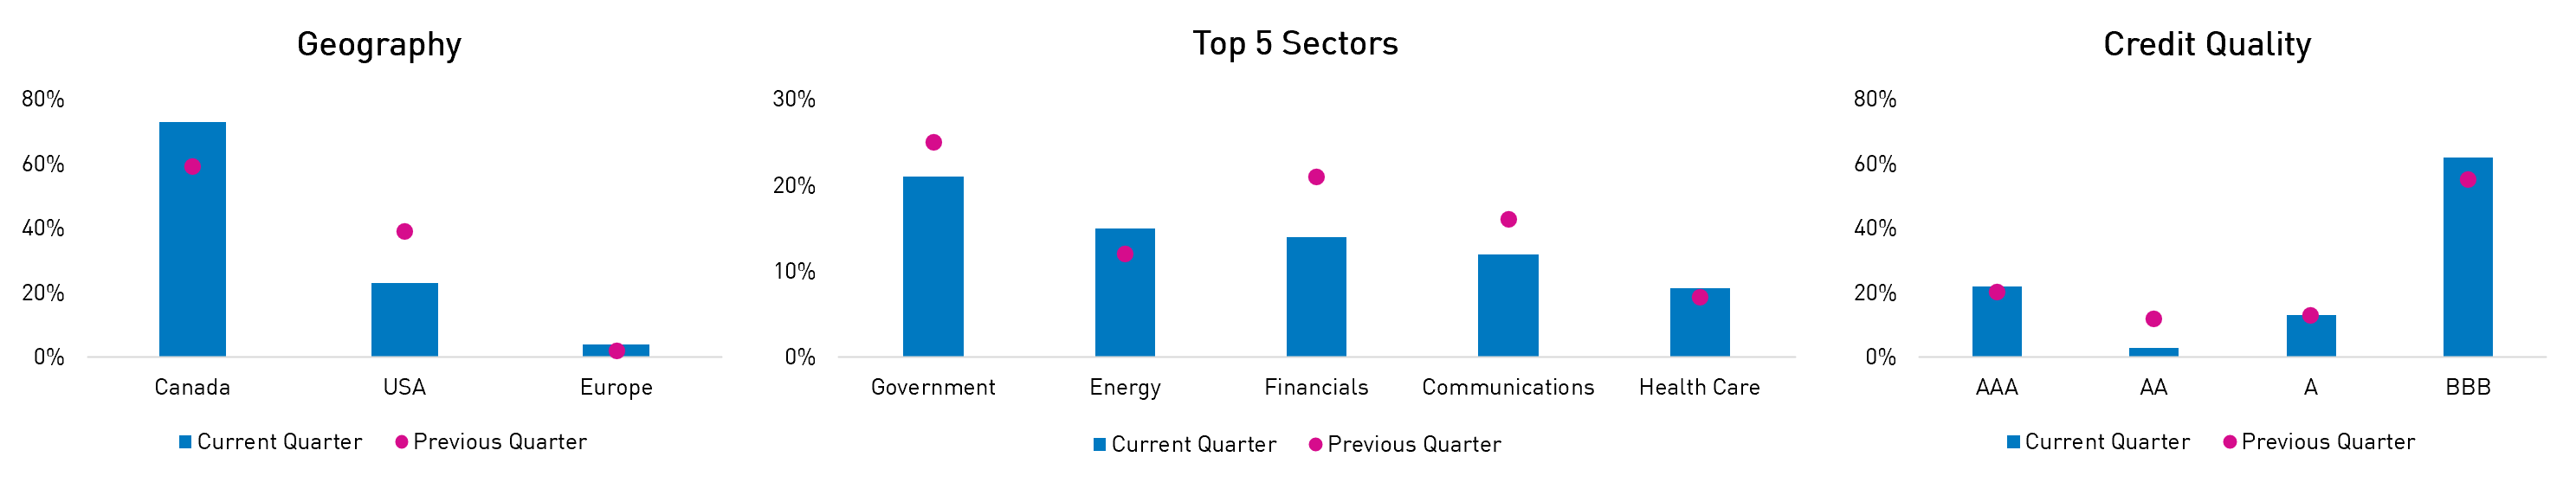
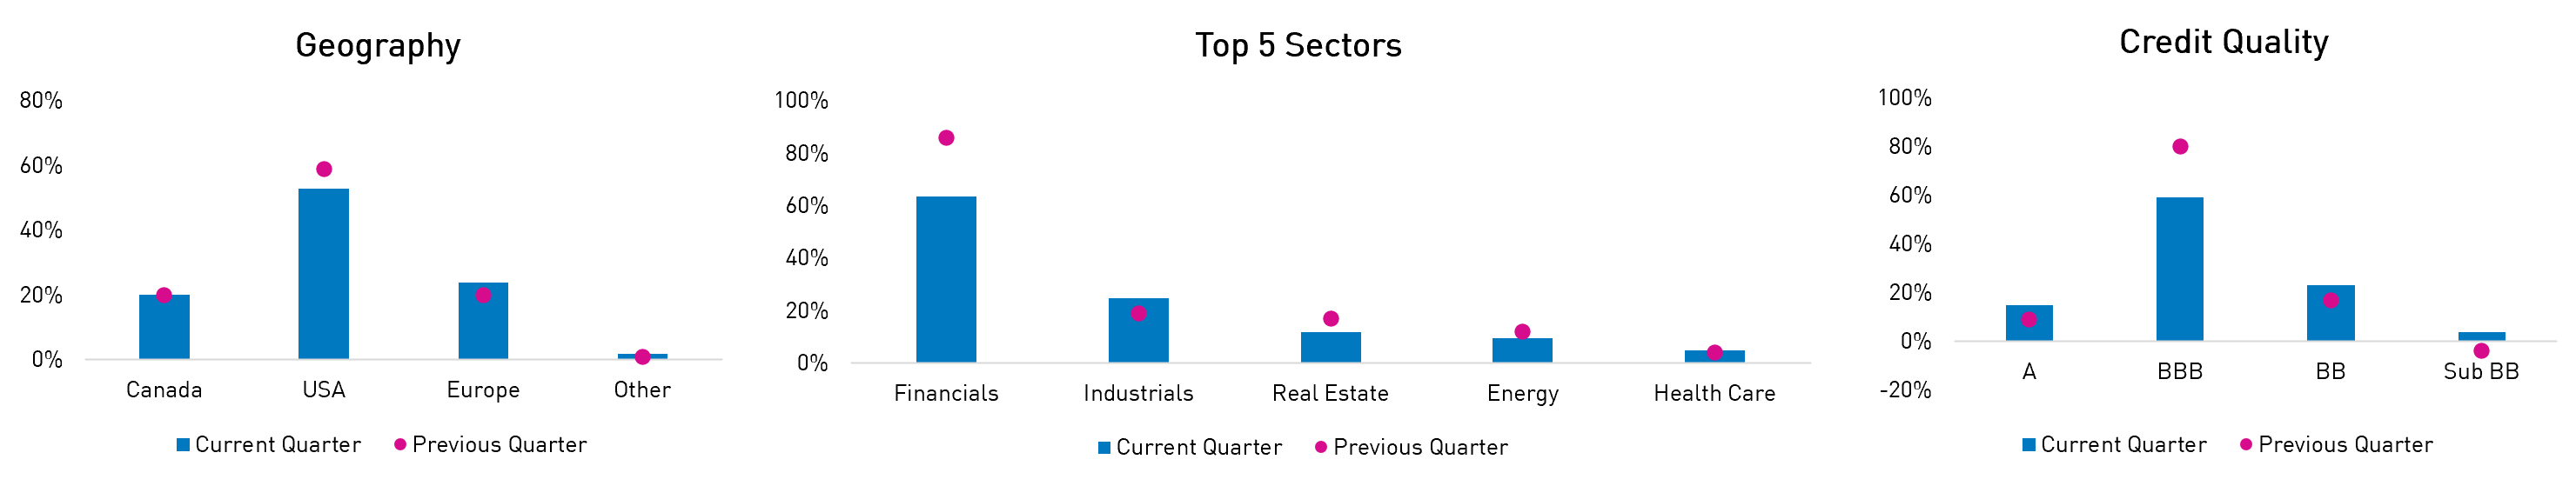
Headline portfolio metrics were relatively unchanged quarter-over-quarter, with modest deviations throughout the period depending on the macroeconomic and valuation backdrop. From a geographic perspective, the portfolio reduced well-performing US-domiciled exposures in favour of adding to attractive opportunities in domestic issuers closer to quarter-end. Sector-wise, profitable financial-related and telecom holdings were trimmed and reallocated across various sectors. In terms of credit quality, the portfolio reduced AA-rated positions in favor of BBB-rated non-financial issuers. We believe the Strategy continues to offer investors a high-quality value proposition, given its healthy yield of 4.8% – greater than the Index’s yield of 4.3% – and the short-dated nature of the portfolio.
| Q1 2024 | Q4 2023 | |
|---|---|---|
| Effective Duration (Years) | 2.5 | 2.5 |
| Credit Duration (Years) | 1.9 | 1.8 |
| Average Term (Years) | 2.8 | 2.8 |
| % Rated Investment Grade | 100% | 100% |
Source: RPIA. Data as of 03/31/2024.
Source: RPIA. Data as of 03/31/2024.
RP Strategic Income Plus Fund
| 1 MON | 3 MON | 6 MON | YTD | 1 YR | 3 YR | 5 YR | Since Inception | |
|---|---|---|---|---|---|---|---|---|
| RP Strategic Income Plus Fund (Class F) | 0.89% | 0.28% | 7.64% | 0.28% | 5.44% | 1.35% | 3.20% | 3.51% |
| FTSE Canada All Corporate Bond Index | 0.54% | 0.07% | 7.70% | 0.07% | 5.50% | -0.03% | 1.72% | 2.42% |
Source: RPIA, FTSE Russell. Data as of 03/31/2024 and annualized for periods greater than one year. SI = 04/2016.
STIP returned +0.28% during the quarter, outperforming the FTSE Canada All Corporate Bond Index (the “Index”), which returned 0.07%.
The Fund produced strong returns from credit spread exposure, while interest rate exposure weighed on total performance. Credit returns were driven by financial-related issuers, which were led by positions in high-quality Yankee banks and global/domestic systemically important banks. Additionally, energy-infrastructure issuers, primarily Canadian multinational pipeline companies, and domestic telecoms, with improving balance sheets, generated strong returns.
| Top Contributors to Credit Return (Sector) |
|---|
| Energy |
|
Communications
|
| Consumers |
Source: RPIA. Data as of 03/31/2024.
| Top Contributors to Credit Return (Issuer) |
|---|
| Telus Corp. |
| Rogers Communications Inc. |
| Bank of Montreal |
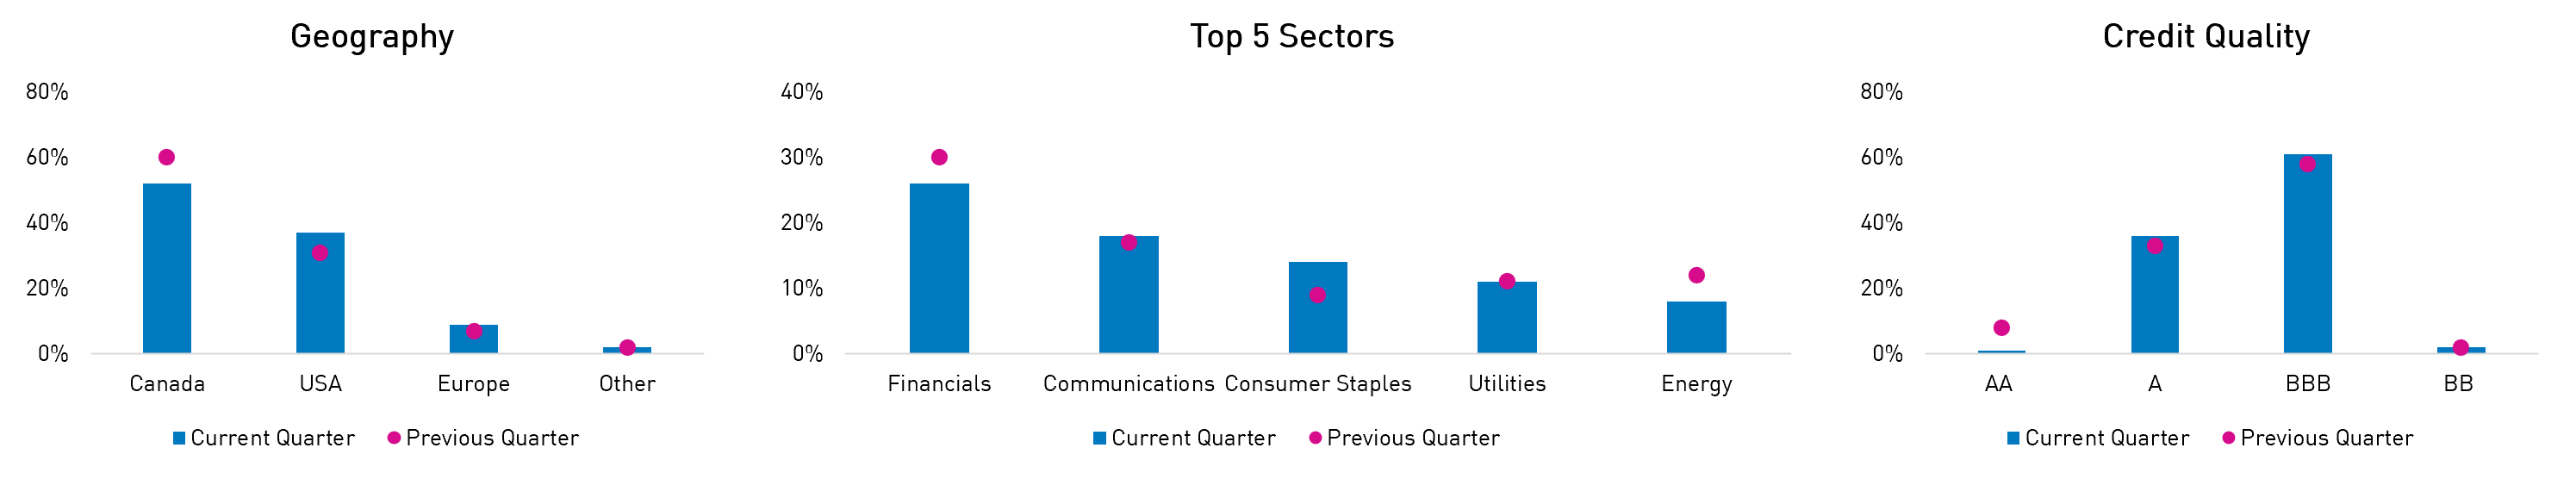
Headline portfolio metrics were actively managed during the quarter. For instance, interest rate exposure was tactically reduced into quarter-end as rate volatility increased while credit exposure increased to capitalize on a favorable technical backdrop that supported credit spread valuations. From a geographic perspective, the portfolio increased US and EUR-domiciled exposures quarter-over-quarter, which proved prescient as domestic credit spreads underperformed. More recently, we are looking to shift exposure back to CAD-domiciled issuers with relatively attractive valuations. Sector-wise, profitable financial-related and energy-infrastructure holdings were trimmed and reallocated to defensive sectors like consumer staples and industrials. In terms of credit quality, the portfolio reduced AA-rated positions primarily in favor of BBB-rated non-financial issuers, and the Fund continues to have minimal (2%) high yield exposure. We believe the Fund will continue to act as a strong alternative to traditional core bond strategies given its ability to actively source returns via both interest rate and credit spread exposures.
| Q1 2024 | Q4 2023 | |
|---|---|---|
| Effective Duration (Years) | 4.6 | 5.1 |
| Credit Duration (Years) | 5.7 | 4.0 |
| Average Term (Years) | 10.0 | 7.3 |
| % Rated Investment Grade | 98% | 98% |
Source: RPIA. Data as of 03/31/2024.
Source: RPIA. Data as of 03/31/2024.
RP Alternative Global Bond Fund
| 1 MON | 3 MON | 6 MON | YTD | 1 YR | 2 YR | 3 YR | Since Inception | |
|---|---|---|---|---|---|---|---|---|
| RP Alternative Global Bond Fund (Class F) |
1.66%
|
3.49%
|
9.56%
|
3.49%
|
12.99%
|
7.56%
|
5.24%
|
6.40%
|
| FTSE Canada All Corporate Bond Index | 0.54% | 0.07% | 7.70% | 0.07% | 5.50% | 2.21% | -0.03% | 1.25% |
Source: RPIA, FTSE Russell. Data as of 03/31/2024 and annualized for periods greater than one year. SI = 07/2019.
AGB returned +3.49% during the quarter, outperforming the FTSE Canada All Corporate Bond Index (the “Index”), which returned 0.07%.
The Fund generated outsized returns from credit spread exposure and prudently navigated volatile interest rate environment exposure, leading to significant outperformance relative to traditional fixed income strategies across the risk spectrum. Credit returns were driven by financial-related issuers, which were led by positions in high-quality Yankee and global systemically important banks, as well as specialty financials like aircraft lessors. Additionally, energy-infrastructure issuers and select consumer discretionary issuers generated strong returns. The portfolio’s dynamic hedging overlay acted as a net detractor, but we remain comfortable with sacrificing modest amounts of yield to embed prudent downside protection.
| Top Contributors to Credit Return (Sector) |
|---|
| Financials |
| Energy |
| Consumers |
Source: RPIA. Data as of 03/31/2024.
| Top Contributors to Credit Return (Issuer) |
|---|
| Intesa Sanpaolo SPA |
| Banco Bilbao Vizcaya Argentaria S.A. |
| Aircastle Ltd. |
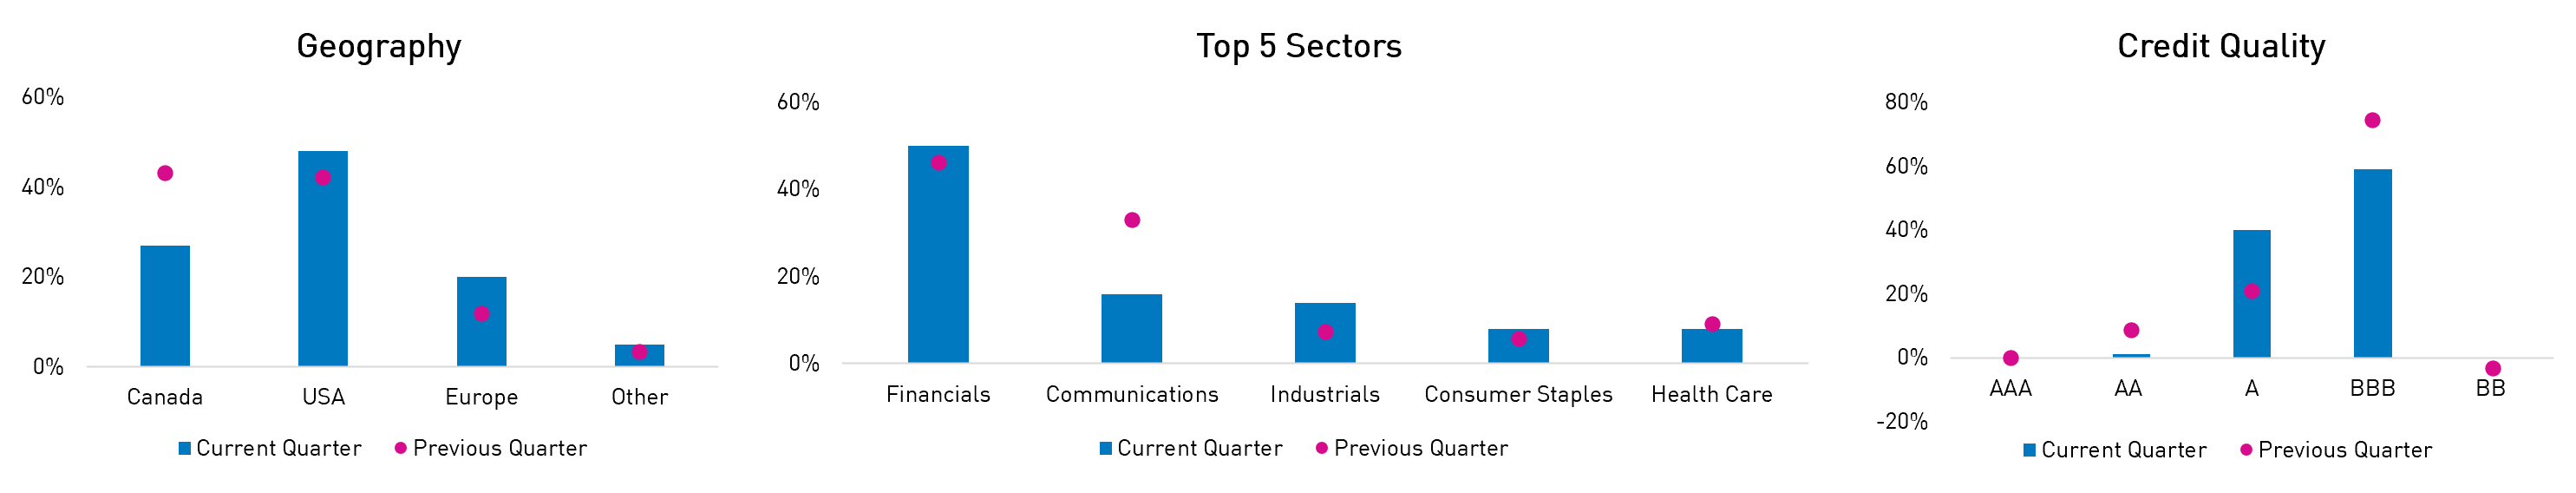
Headline portfolio metrics were actively managed during the quarter, particularly from an interest rate exposure perspective, in response to fluctuating expectations of the future path of central bank rates. For instance, effective duration ranged from a low of 0.3yrs to a high of 3.9yrs during the period. Credit exposure increased notably in March to capitalize on a favorable technical backdrop that supported credit spread valuations. From a geographic perspective, the portfolio increased US and EUR-domiciled exposures quarter-over-quarter, which proved prescient as domestic credit spreads underperformed. More recently, we are looking to shift exposure back to CAD-domiciled issuers with relatively attractive valuations. Sector-wise, profitable TMT-related and energy-infrastructure holdings were trimmed and reallocated to defensive sectors like industrials. In terms of credit quality, the portfolio reduced AA-rated and BBB-rated positions in favor of A-rated issuers, and the Fund continues to have minimal to no high yield exposure. We believe the Fund is well positioned to continue to navigate ever-changing markets and generate strong risk-adjusted returns, given its alternative toolkit and commonsense approach to managing risk exposures.
| Q1 2024 | Q4 2023 | |
|---|---|---|
| Effective Duration (Years) | 1.8 | 0.9 |
| Credit Duration (Years) | 8.3 | 3.6 |
| Average Term (Years) | 5.4 | 2.8 |
| Net Credit Leverage | 2.0x | 1.7x |
| % Rated Investment Grade | 100% | 103% |
Source: RPIA. Data as of 03/31/2024.
Source: RPIA. Data as of 03/31/2024.
RP Debt Opportunities
| 1 MON | 3 MON | 6 MON | YTD | 1 YR | 3 YR | 5 YR | 10 YR | Since Inception | |
|---|---|---|---|---|---|---|---|---|---|
| RP Debt Opportunities | 1.31% | 3.26% | 7.17% | 3.26% | 12.19% | 5.26% | 5.30% | 5.54% | 7.75% |
| FTSE Canada All Corporate Bond Index | 0.54% | 0.07% | 7.70% | 0.07% | 5.50% | -0.03% | 1.72% | 2.80% | 3.75% |
Source: RPIA, FTSE Russell. Data as of 03/31/2024 and annualized for periods greater than one year. SI = 10/2009. RP Debt Opportunities strategy performance presented above represents a composite return of RP Debt Opportunities Fund LP Class A and RP Debt Opportunities Fund Ltd. Class A, from October 2009 to July 2011 and RP Debt Opportunities Fund Ltd. Class A. from August 2011 onwards.
DOF returned +3.26% during the quarter, notably outperforming the FTSE Canada All Corporate Bond Index (the “Index”), which returned 0.07%.
The Strategy generated outsized returns from credit spread exposure and prudently navigated volatile interest rate environment exposure, leading to its 12th consecutive month of positive returns. Credit returns were driven by financial-related issuers, which were led by positions in high-quality Yankee and global systemically important banks, as well as specialty financials like aircraft lessors. Additionally, consumer-related issuers, both staples and discretionary, and telecom and media issuers generated strong returns. Select holdings across other sectors, like a reverse Yankee industrial position in Carrier Global, also provided notable returns. The portfolio’s dynamic hedging overlay acted as a net detractor, but we remain comfortable with sacrificing modest amounts of yield to embed prudent downside protection.
| Top Contributors to Credit Return (Sector) |
|---|
| Financials |
| Consumers |
| Communications |
Source: RPIA. Data as of 03/31/2024.
| Top Contributors to Credit Return (Issuer) |
|---|
| Lloyds Banking Group plc |
| Barclays plc |
| Carrier Global Corp. |
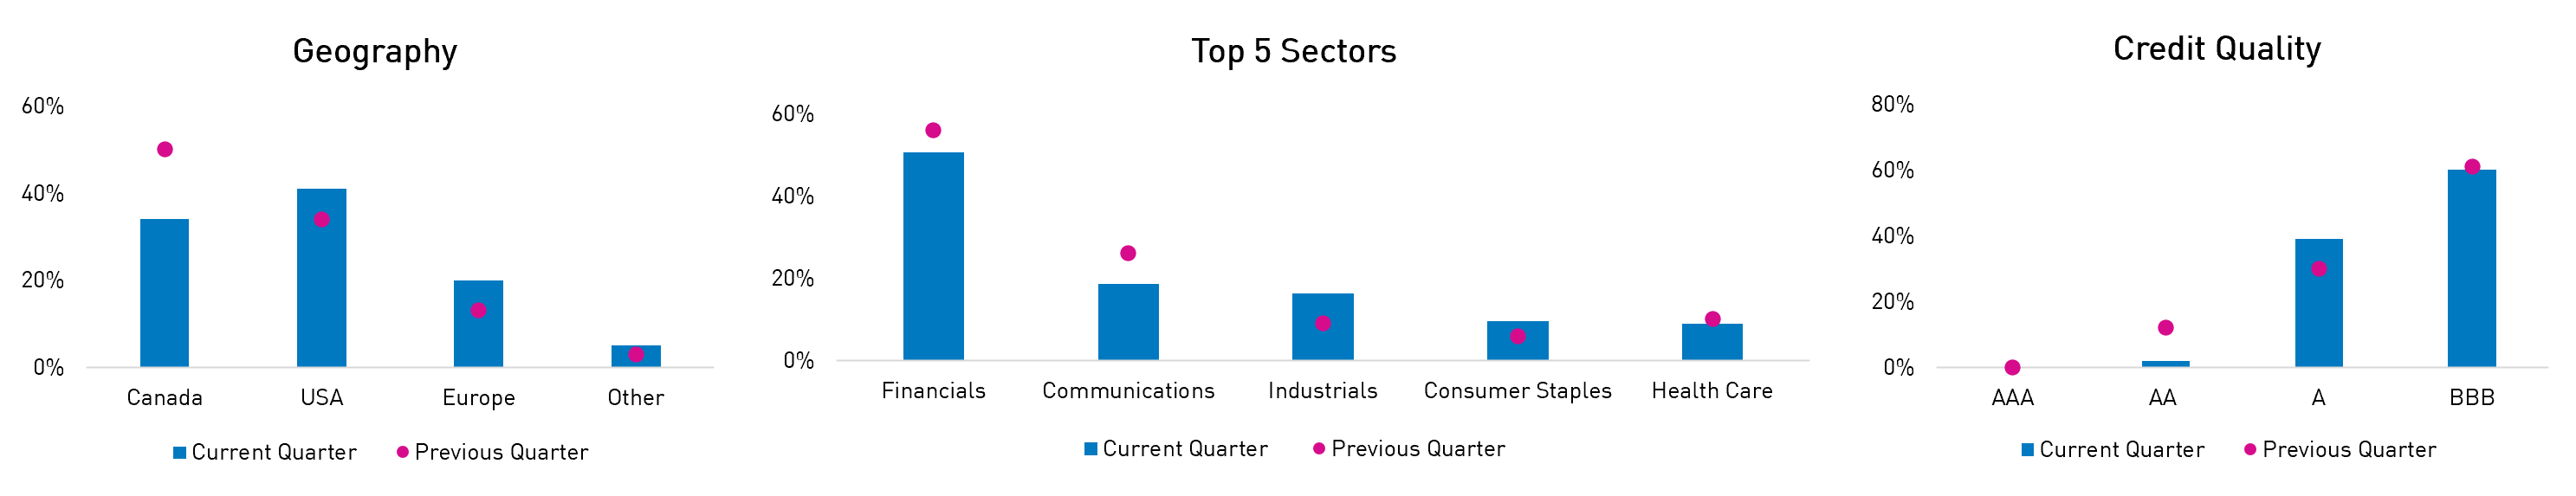
Headline portfolio metrics were actively managed during the quarter in response to fluctuating expectations of the future path of central bank rates and a favorable technical backdrop that supported credit spread valuations. The portfolio’s interest rate exposure remained subdued relative to traditional investment grade bond strategies, given the Strategy is primarily focused on credit spreads. Alternatively, credit exposure increased opportunistically in March to capitalize on the supportive technical backdrop. From a geographic perspective, the portfolio increased non-domestic exposures quarter-over-quarter, which proved prescient as domestic credit spreads underperformed. More recently, we are looking to shift exposure back to CAD-domiciled issuers with relatively attractive valuations. Sector-wise, profitable TMT, financial, and energy-infrastructure holdings were trimmed and reallocated to defensive sectors like industrials and consumer staples. In terms of credit quality, the portfolio reduced AA-rated and BBB-rated positions in favor of A-rated issuers and modestly reduced its net short position in high yield. We believe the Strategy is well positioned to continue to navigate ever-changing markets and generate strong risk-adjusted returns, given its alternative toolkit and focus on credit spreads, which we believe are well supported despite rich index-level valuations.
| Q1 2024 | Q4 2023 | |
|---|---|---|
| Effective Duration (Years) | 1.1 | 0.5 |
| Credit Duration (Years) | 1.2 | 3.8 |
| Average Term (Years) | 4.2 | 1.9 |
| Net Credit Leverage | 2.5x | 2.5x |
| % Rated Investment Grade | 101% | 104% |
Source: RPIA. Data as of 03/31/2024.
Source: RPIA. Data as of 03/31/2024.
RP Select Opportunities
| 1 MON | 3 MON | 6 MON | YTD | 1 YR | 3 YR | 5 YR | 10 YR | Since Inception | |
|---|---|---|---|---|---|---|---|---|---|
| RP Select Opportunities Strategy | 1.42% | 4.57% | 9.39% | 4.57% | 16.57% | 7.67% | 9.34% | 8.37% | 8.37% |
| Bloomberg US High Yield (CAD Hedged) | 1.14% | 1.34% | 8.22% | 1.34% | 10.22% | 1.62% | 3.45% | 3.89% | 3.89% |
Source: RPIA, FTSE Russell. Data as of 03/31/2024 and annualized for periods greater than one year. SI = 04/2014. RP Select Opportunities strategy performance presented above is a hypothetical illustration based on the weighted average composite return of a separately managed account utilizing a similar strategy from inception in April 2014 to May 2014, then linked to the returns of RP Select Opportunities Cayman Fund Ltd. – Class C Lead.
SOF returned +4.57% during the quarter, notably outperforming the Bloomberg US High Yield (CAD Hedged) Bond Index (the “Index”), which returned +1.34%.
The Strategy’s outperformance relative to traditional fixed income strategies across the risk spectrum can be attributed to SOF’s ability to generate outsized returns from credit spread exposure. Credit returns were driven by financial-related positions, which were led by specialty financials, like aircraft lessors and business development companies, as well as European banks. Additionally, consumer-related issuers, particularly airlines, and debt of energy-infrastructure companies generated strong returns. The portfolio’s dynamic hedging overlay acted as a net detractor, but we remain comfortable with sacrificing modest amounts of yield to embed prudent downside protection.
| Top Contributors to Credit Return (Sector) |
|---|
| Financials |
| Consumers |
| Energy |
| Top Contributors to Credit Return (Issuer) |
|---|
| BGC Group Inc. |
| American Airlines Inc. |
| Aircastle Ltd. |
Headline portfolio metrics were actively managed during the quarter in response to fluctuating expectations of the future path of central bank rates and a favorable technical backdrop that supported credit spread valuations. Accordingly, the portfolio’s credit exposure increased opportunistically in March to capitalize on the supportive technical backdrop. From a geographic perspective, the portfolio trimmed well-performing US-domiciled exposure in favour of increasing relatively attractive EUR-domiciled exposure. Sector-wise, profitable financial exposures were reduced from a heavy overweight position and reallocated across various sectors; note that the portfolio remains net short consumer-related issuers. In terms of credit quality, the portfolio’s overweight to investment grade was trimmed quarter-over-quarter as BBB-rated exposures were reduced in favour of adding back to high-yield issuers. We believe the Strategy is well-positioned to continue providing investors with strong risk-adjusted returns as an effective alternative to traditional fixed income, equity, and private asset allocations.
| Q1 2024 | Q4 2023 | |
|---|---|---|
| Effective Duration (Years) | 2.6 | 1.2 |
| Credit Duration (Years) | 4.1 | 2.7 |
| Average Term (Years) | 4.0 | 2.9 |
| Net Credit Leverage | 1.5x | 1.3x |
| % Rated Investment Grade | 74% | 88% |
Source: RPIA. Data as of 03/31/2024.
Source: RPIA. Data as of 03/31/2024.