
Market Commentary
Central banks officially began loosening monetary policy this past quarter, with the Bank of Canada and the European Central Bank leading the charge with 25-point rate cuts. In Canada, as underlying inflation continues to ease, the Governing Council feels confident that the 2% target can be achievable over time. South of the border, where disinflation has been slow due to a resilient economy, the U.S. Fed has held rates amid concerns of reigniting inflation.
As central banks begin to cut overnight interest rates, the rates available to cash allocations will begin to decline. Amid the volatile economic and political backdrop that darkens this process, we believe investors should start to redeploy cash into active fixed income solutions that can provide both return generation and risk management.
RP Fixed Income Plus
| 1 MON | 3 MON | 6 MON | YTD | 1 YR | 3 YR | 5 YR | 10 YR | Since Inception | |
|---|---|---|---|---|---|---|---|---|---|
| RP Fixed Income Plus |
0.70%
|
1.10%
|
1.42%
|
1.42%
|
5.68%
|
2.04%
|
1.98%
|
2.23%
|
3.46%
|
| FTSE Canada Universe Short-Term Bond Index |
0.75%
|
1.24%
|
1.57%
|
1.57%
|
5.61%
|
0.64%
|
1.40%
|
1.66%
|
2.02%
|
| Added Value |
-0.05%
|
-0.14%
|
-0.15%
|
-0.15%
|
0.06%
|
1.40%
|
0.58%
|
0.57%
|
1.43%
|
Source: RPIA. FTSE Russell. Data as of 06/30/2024 and annualized for periods greater than one year. SI = 07/2010. RP Fixed Income Plus strategy performance presented above represents a weighted-average composite return of separately managed accounts utilizing a similar strategy from inception in July 2010 to April 2013 and linked to the returns of the RP Fixed Income Plus Fund, Series A thereafter.
FIP returned +1.10% during the quarter, modestly underperforming the FTSE Canada Universe Short-Term Bond Index (the “Index”).
The Strategy produced returns from credit spread exposure, while interest rate exposure drove the majority of returns as rates rallied. Credit returns were driven by financial-related issuers, including global/domestic systematically important banks, and short-dated bonds of the financial services subsidiary of Ford Canada.
| Top Contributors to Credit Return (Sector) |
|---|
| Financials |
| Consumers/Autos |
| Energy |
Source: RPIA. Data as of 06/30/2024.
| Top Contributors to Credit Return (Issuer) |
|---|
| Bank of America Corp. |
| Ford Credit Canada Co. |
| Algonquin Power & Utilities Corp. |
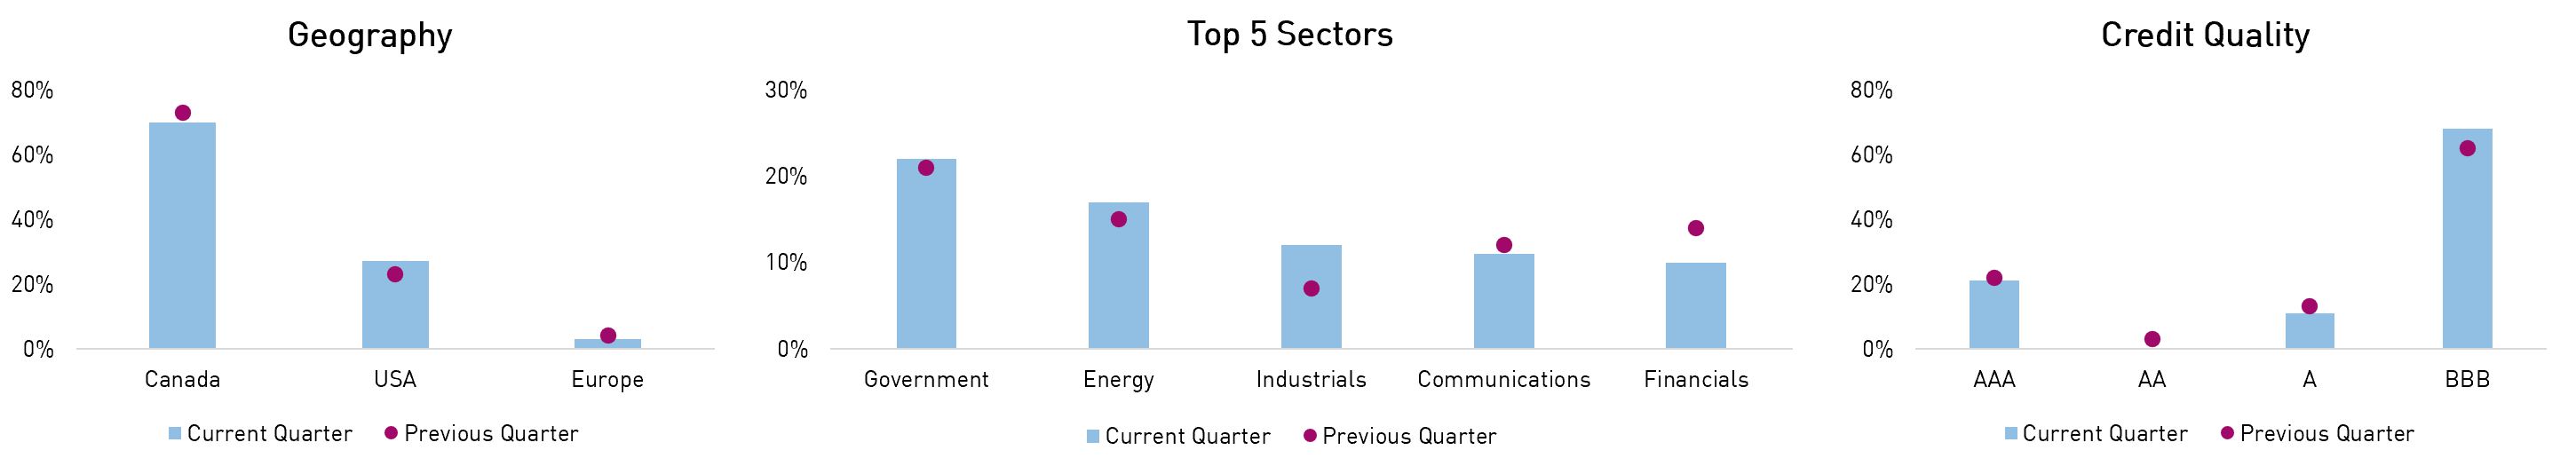
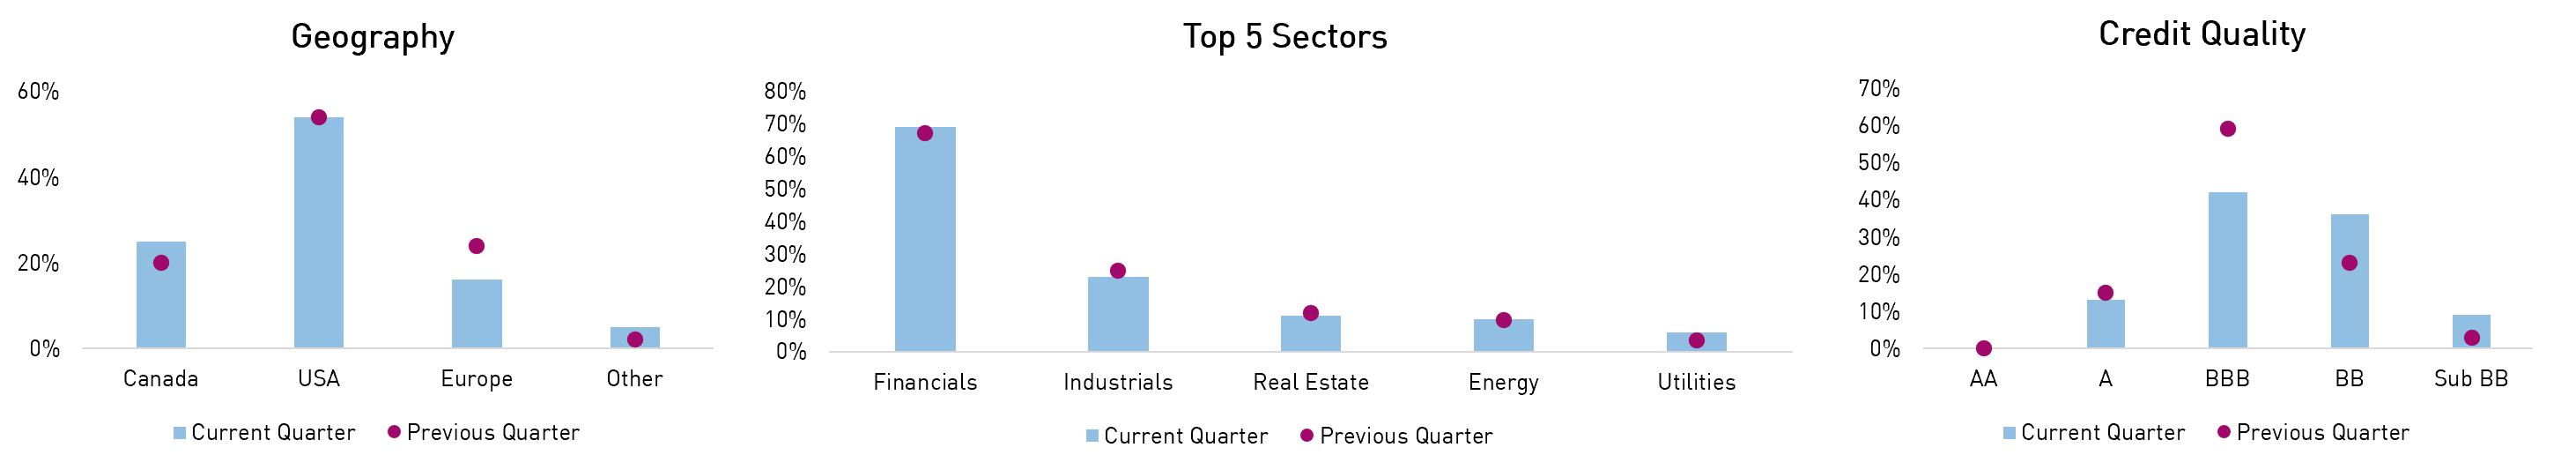
Headline portfolio metrics were relatively unchanged quarter-over-quarter, while modest deviations occurred throughout the period in response to the changing macroeconomic and valuation backdrop. From a geographic perspective, the portfolio reduced well-performing domestic exposures in favour of adding to attractive opportunities in the US market. Sector-wise, profitable financial-related and healthcare holdings were trimmed and reallocated to auto-related and industrial issuers. In terms of credit quality, the portfolio rotated modestly from high-quality exposures in favor of BBB rated non-financial issuers. We believe the Strategy continues to offer investors a high-quality value proposition, given its healthy yield of 4.8% – greater than the Index’s yield of 4.2% – and the short-dated nature of the portfolio.
| Q2 2024 | Q1 2024 | |
|---|---|---|
| Effective Duration (Years) | 2.6 | 2.5 |
| Credit Duration (Years) | 1.9 | 1.9 |
| Average Term (Years) | 3.0 | 2.8 |
| % Rated Investment Grade | 100% | 100% |
Source: RPIA. Data as of 06/30/2024.
Source: RPIA. Data as of 06/30/2024.
RP Strategic Income Plus Fund
| 1 MON | 3 MON | 6 MON | YTD | 1 YR | 3 YR | 5 YR | Since Inception | |
|---|---|---|---|---|---|---|---|---|
| RP Strategic Income Plus Fund (Class F) |
0.72%
|
1.05%
|
1.33%
|
1.33%
|
6.25%
|
1.24%
|
2.95%
|
3.54%
|
| FTSE Canada All Corporate Bond Index | 0.96% | 1.09% | 1.16% | 1.16% | 6.46% | -0.09% | 1.40% | 2.47% |
Source: RPIA, FTSE Russell. Data as of 06/30/2024 and annualized for periods greater than one year. SI = 04/2016.
STIP returned +1.05% during the quarter, performing in line with the FTSE Canada All Corporate Bond Index (the “Index”) during the period while outperforming the Index year-to-date.
Both credit spread and interest rate exposure contributed to total returns during the quarter. Credit returns were driven by positions in high-quality global/domestic systemically important banks and large domestic telecom issuers. Canadian multinational pipeline companies and the Fund’s participation in Coastal GasLink’s historic bond offering – the largest in corporate Canadian history – also generated strong returns.
| Top Contributors to Credit Return (Sector) |
|---|
| Financials |
Industrials/Energy-Infrastructure |
| Telecommunications |
Source: RPIA. Data as of 06/30/2024.
| Top Contributors to Credit Return (Issuer) |
|---|
| TransCanada Pipelines Ltd. |
| Coastal Gaslink Pipeline LP |
| JP Morgan Chase & Co. |
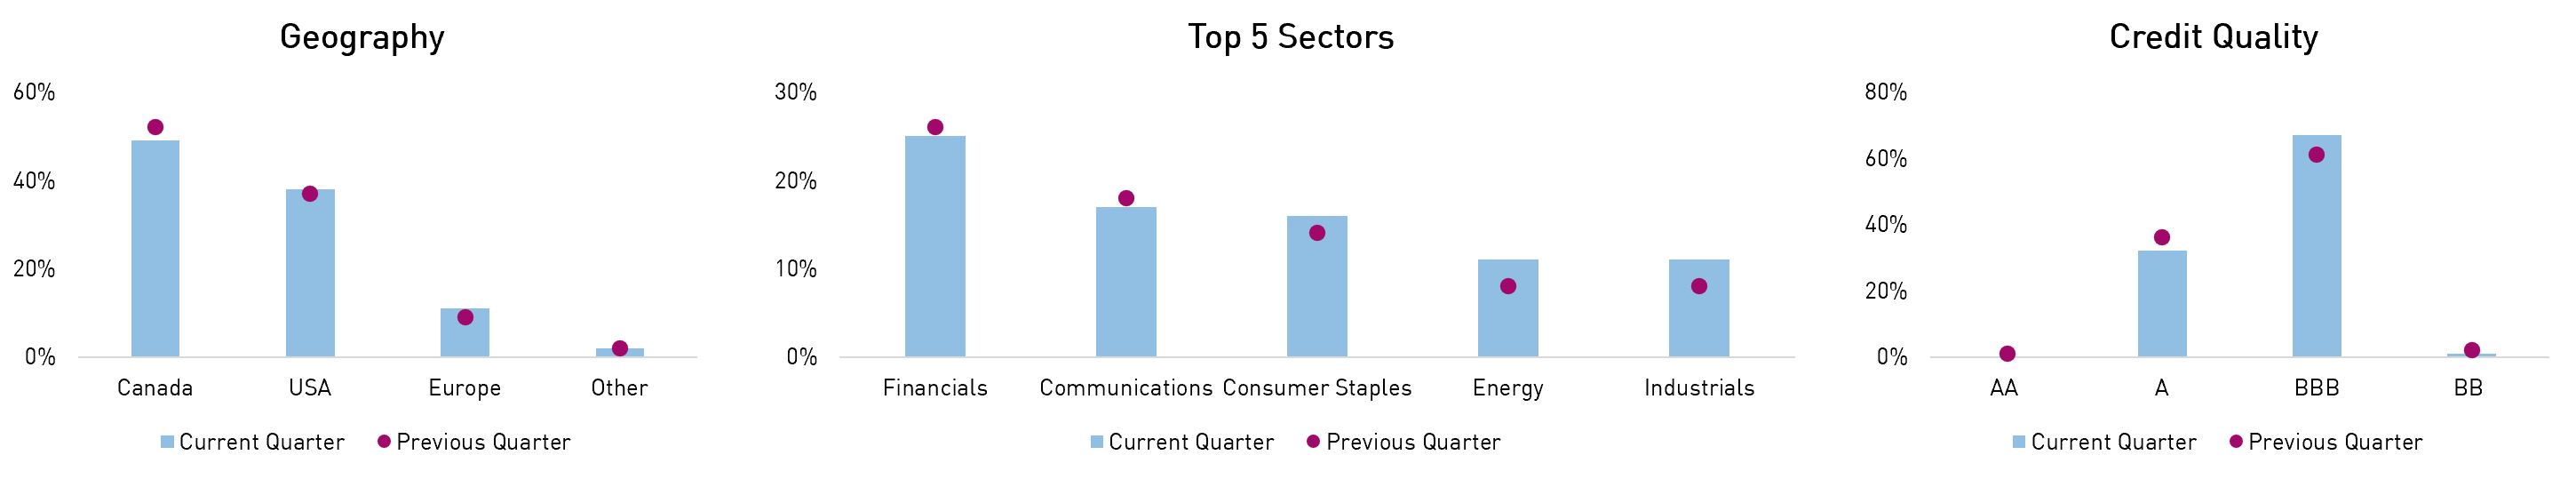
Headline portfolio metrics were actively managed but relatively unchanged quarter-over-quarter, barring a modest extension in term risk to capture opportunities as credit curves steepened. Geographically, the portfolio modestly increased US and EUR-domiciled exposures, the latter of which continues to be concentrated on high-quality Yankee banks and corporate issuers with global operations. Sector-wise, the portfolio actively managed its financial exposure based on valuations while adding to defensive sectors like consumer staples and industrials.
Quality-wise, the portfolio finished the period with an A- rating and minimal (1%) high yield exposure, which primarily consists of a corporate hybrid security of a domestic telecom that is rated investment grade at the issuer level. We believe the Fund can continue to actively source returns from both interest rate and credit spread exposure, underpinned by an attractive technical environment for credit.
| Q2 2024 | Q1 2024 | |
|---|---|---|
| Effective Duration (Years) | 4.7 | 4.6 |
| Credit Duration (Years) | 5.4 | 5.7 |
| Average Term (Years) | 11.1 | 10.5 |
| % Rated Investment Grade | 99% | 98% |
Source: RPIA. Data as of 06/30/2024.
Source: RPIA. Data as of 06/30/2024.
RP Alternative Global Bond Fund
| 1 MON | 3 MON | 6 MON | YTD | 1 YR | 2 YR | 3 YR | Since Inception | |
|---|---|---|---|---|---|---|---|---|
| RP Alternative Global Bond Fund (Class F) |
0.10%
|
1.91%
|
5.46%
|
5.46%
|
12.19%
|
9.06%
|
5.07%
|
6.47%
|
| FTSE Canada All Corporate Bond Index | 0.96% | 1.09% | 1.16% | 1.16% | 6.46% | 5.34% | -0.09% | 1.40% |
Source: RPIA, FTSE Russell. Data as of 06/30/2024 and annualized for periods greater than one year. SI = 07/2019.
AGB returned +1.91% during the quarter, outperforming the FTSE Canada All Corporate Bond Index (the “Index”) by +82bps.
The Fund generated outsized returns from credit spread exposure and participated well in the rally of short to intermediary Canadian risk-free yields. Credit returns were driven by positions in high-quality Yankee and global systemically important banks, as well as specialty financials like aircraft lessors. Energy-infrastructure issuers, led by a sizeable position in Coastal GasLink’s historic bond offering, and select consumer discretionary issuers also generated strong returns.
| Top Contributors to Credit Return (Sector) |
|---|
| Financials |
| Industrials/Energy-Infrastructure |
| Consumers |
Source: RPIA. Data as of 06/30/2024.
| Top Contributors to Credit Return (Issuer) |
|---|
| Coastal Gaslink Pipeline LP |
| Banco Santander S.A. |
| Morgan Stanley |
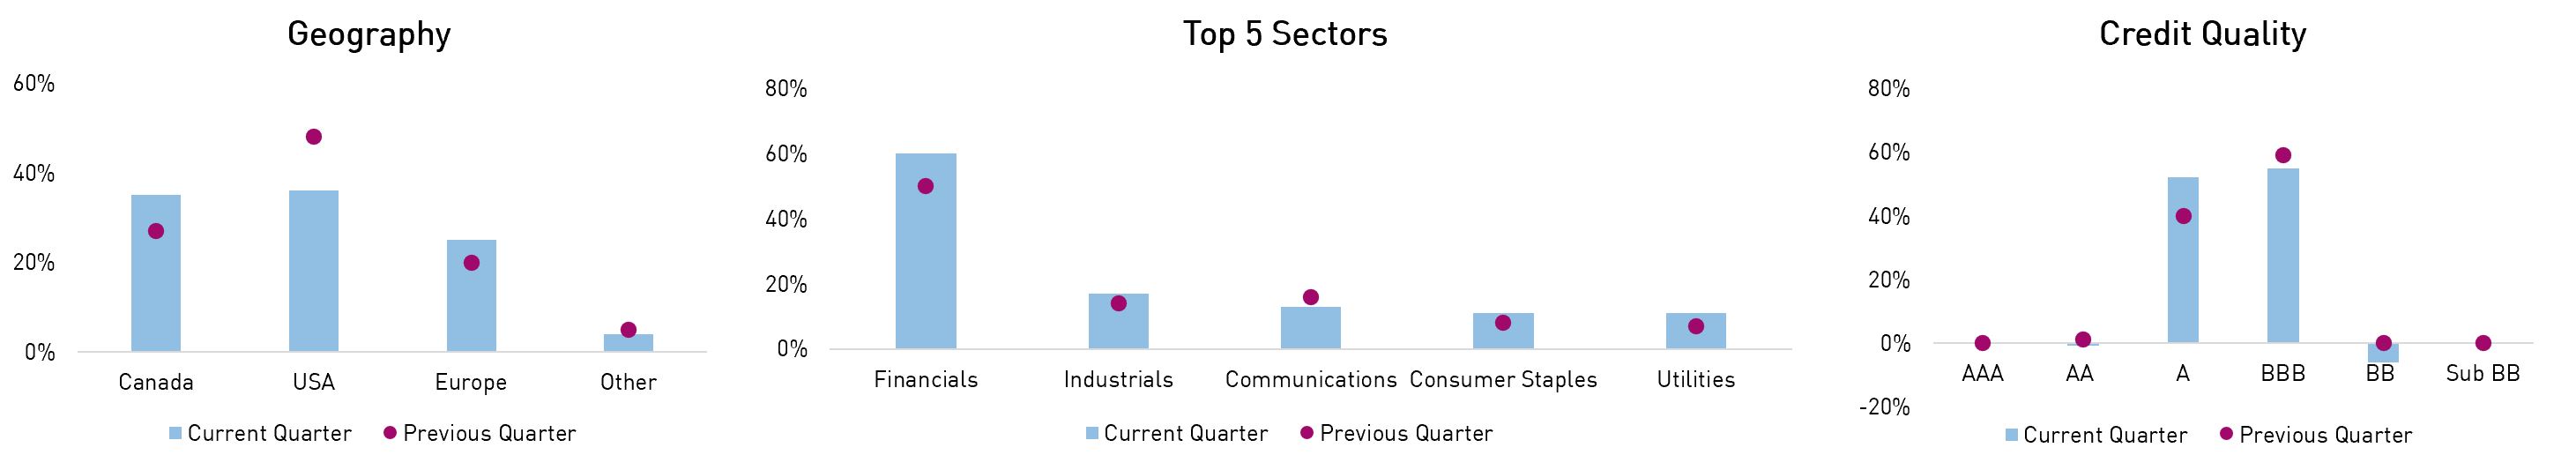
Headline interest rate exposure increased while credit risk decreased quarter-over-quarter as profits were realized and short-term value dynamics argued for a more cautious approach. Geographically, the portfolio decreased US-domiciled exposures in favour of adding to attractive deals in the domestic and European markets. Sector-wise, the Fund added to more defensive industries, including high-quality banks, consumer staples, and industrials, and notably added to its hedging portfolio.
In terms of credit quality, the portfolio reduced BBB rated and BB rated positions in favor of A rated issuers, and the Fund ended the period with a net short exposure to high yield. We believe the Fund is well positioned to continue navigating the constantly changing spread and rate markets to generate strong risk-adjusted returns, given its expanded toolkit and commonsense approach.
| Q2 2024 | Q1 2024 | |
|---|---|---|
| Effective Duration (Years) | 3.2 | 1.8 |
| Credit Duration (Years) | 5.9 | 8.3 |
| Average Term (Years) | 7.4 | 5.4 |
| Net Credit Leverage | 1.2x | 2.0x |
| % Rated Investment Grade | 106% | 100% |
Source: RPIA. Data as of 06/30/2024.
Source: RPIA. Data as of 06/30/2024.
RP Debt Opportunities
| 1 MON | 3 MON | 6 MON | YTD | 1 YR | 3 YR | 5 YR | 10 YR | Since Inception | |
|---|---|---|---|---|---|---|---|---|---|
| RP Debt Opportunities | 0.04% | 1.82% | 5.15% | 5.15% | 11.27% | 5.19% | 5.28% | 5.53% | 7.75% |
| FTSE Canada All Corporate Bond Index | 0.96% | 1.09% | 1.16% | 1.16% | 6.46% | -0.09 | 1.40% | 2.73% | 3.76% |
Source: RPIA, FTSE Russell. Data as of 06/30/2024 and annualized for periods greater than one year. SI = 10/2009. RP Debt Opportunities strategy performance presented above represents a composite return of RP Debt Opportunities Fund LP Class A and RP Debt Opportunities Fund Ltd. Class A, from October 2009 to July 2011 and RP Debt Opportunities Fund Ltd. Class A. from August 2011 onwards.
DOF returned +1.82% during the quarter, outperforming the FTSE Canada All Corporate Bond Index (the “Index”) by +73bps.
The Strategy generated outsized returns from credit spread exposure and prudently navigated a volatile interest rate environment. Credit returns were driven by positions in high-quality Yankee and global systemically important banks and select consumer discretionary and real estate issuers. A sizeable position in Coastal GasLink’s historic bond offering – the largest in corporate Canadian history – was the top contributor during the quarter. The portfolio’s dynamic hedging overlay acted as a net detractor, but we remain comfortable with sacrificing modest amounts of yield to embed prudent downside protection.
| Top Contributors to Credit Return (Sector) |
|---|
| Financials |
| Industrials/Energy-Infrastructure |
| Consumers |
Source: RPIA. Data as of 06/30/2024.
| Top Contributors to Credit Return (Issuer) |
|---|
| Coastal Gaslink Pipeline LP |
| Banco Santander S.A. |
| Brandywine Operating Partnership LP |
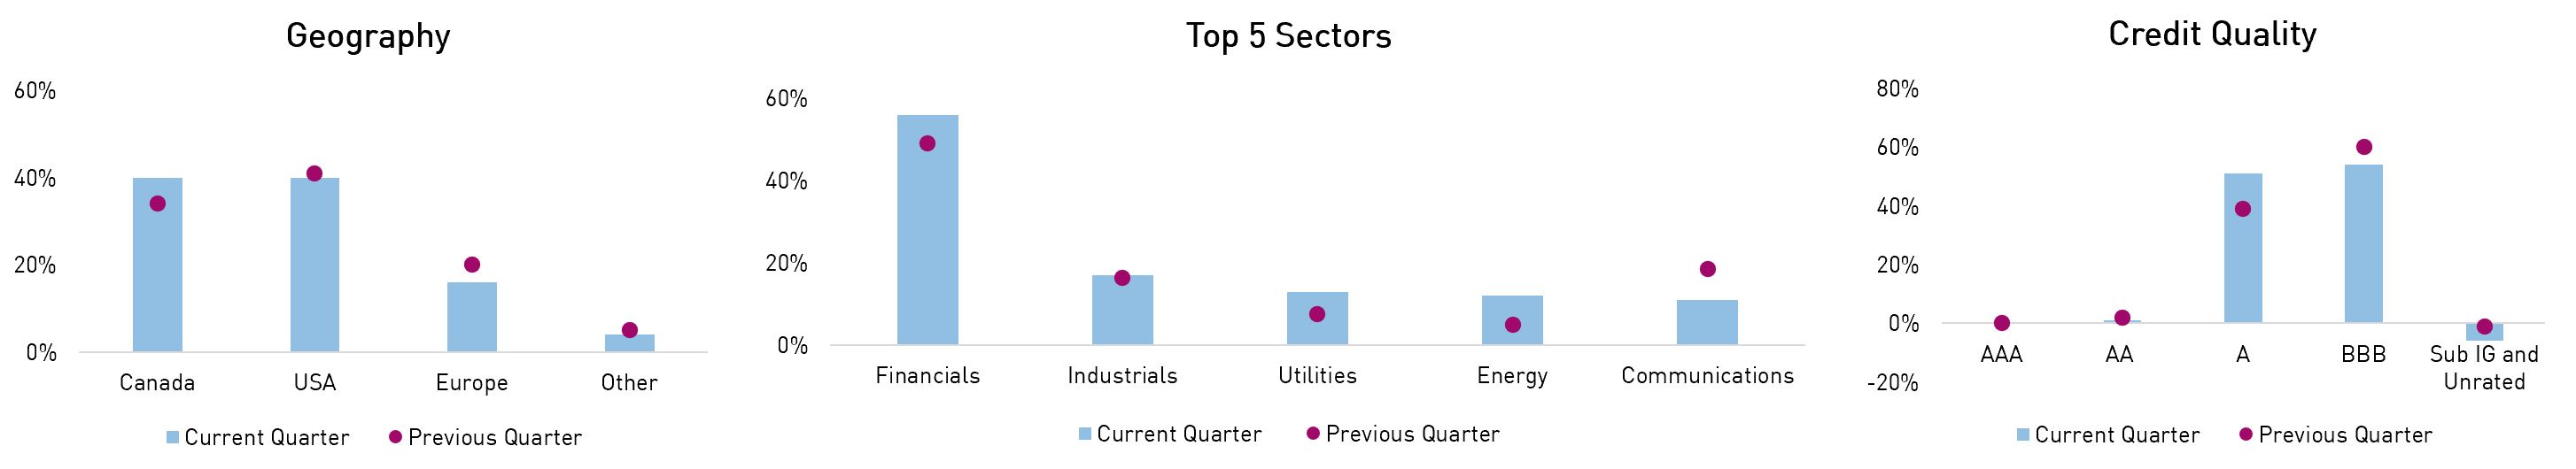
Interest rate exposure remained unchanged quarter-over-quarter while credit spread exposure was notably reduced as profits were realized and short-term value dynamics argued for a more cautious approach. Geographically, the portfolio decreased non-North American domiciled exposures in favour of adding to attractive deals in the domestic market. Sector-wise, TMT-related and healthcare issuers were trimmed, while financial and dynamic hedging exposures increased.
In terms of credit quality, the portfolio reduced BBB rated and BB rated positions in favor of A rated issuers, and the portfolio ended the period with a net short exposure to high yield. We believe the Strategy is well positioned to continue to navigate ever-changing markets and generate strong risk-adjusted returns, given its expanded toolkit and commonsense approach to managing market exposures.
| Q2 2024 | Q1 2024 | |
|---|---|---|
| Effective Duration (Years) | 1.2 | 1.1 |
| Credit Duration (Years) | 5.7 | 8.4 |
| Average Term (Years) | 4.9 | 4.2 |
| Net Credit Leverage | 1.6x | 2.5x |
| % Rated Investment Grade | 106% | 101% |
Source: RPIA. Data as of 06/30/2024.
Source: RPIA. Data as of 06/30/2024.
RP Select Opportunities
| 1 MON | 3 MON | 6 MON | YTD | 1 YR | 3 YR | 5 YR | 10 YR | Since Inception | |
|---|---|---|---|---|---|---|---|---|---|
| RP Select Opportunities Strategy | 0.54% | 1.92% | 6.58% | 6.58% | 15.15% | 7.11% | 9.29% |
8.22%
|
8.36% |
| Bloomberg US High Yield (CAD Hedged) | 0.89% | 0.92% | 2.26% | 2.26% | 9.56% | 1.02% | 3.19% | 3.71% | 3.88% |
Source: RPIA, Bloomberg. Data as of 06/30/2024 and annualized for periods greater than one year. SI = 04/2014. RP Select Opportunities strategy performance presented above is a hypothetical illustration based on the weighted average composite return of a separately managed account utilizing a similar strategy from inception in April 2014 to May 2014, then linked to the returns of RP Select Opportunities Cayman Fund Ltd. – Class C Lead.
SOF returned +1.92% during the quarter, notably outperforming the Bloomberg US High Yield (CAD Hedged) Bond Index (the “Index”) by +100bps.
The Strategy’s outperformance relative to traditional fixed income strategies across the risk spectrum can be attributed to SOF’s ability to generate outsized returns from credit spread exposure. Credit returns were driven by specialty financials like aircraft lessors and business development companies. Additionally, consumer-related issuers, particularly airlines and cruise lines, and debt of energy companies generated strong returns. The portfolio’s dynamic hedging overlay acted as a net detractor, but we remain comfortable with sacrificing modest amounts of yield to embed prudent downside protection.
| Top Contributors to Credit Return (Sector) |
|---|
| Financials |
| Consumers |
| Energy |
Source: RPIA. Data as of 06/30/2024.
| Top Contributors to Credit Return (Issuer) |
|---|
| Geo Group Inc./The |
| Air Canada |
| Brandywine Operating Partnership LP |
Headline interest rate exposure was modestly increased, while credit risk was relatively unchanged quarter-over-quarter. Geographically, the portfolio trimmed well-performing EUR-domiciled exposure in favour of increasing exposure to domestic credits. Sector-wise, profits were realized in well-performing positions across sectors, and the portfolio tactically reversed its net short consumer-related exposure. In terms of credit quality, the portfolio’s overweight to investment grade was trimmed quarter-over-quarter as BBB rated exposures were reduced in favour of adding back to select high yield issuers. We believe the Strategy is well-positioned to continue providing investors with strong risk-adjusted returns as an effective alternative to traditional fixed income, equity, and private asset allocations.
| Q2 2024 | Q1 2024 | |
|---|---|---|
| Effective Duration (Years) | 3.3 | 2.6 |
| Credit Duration (Years) | 4.4 | 4.1 |
| Average Term (Years) | 5.7 | 4.0 |
| Net Credit Leverage | 1.3x | 1.5x |
| % Rated Investment Grade | 55% | 74% |
Source: RPIA. Data as of 06/30/2024.
Source: RPIA. Data as of 06/30/2024.