Amid a quarter marked by notable shifts across asset classes, we have compiled five charts that we think highlight some of the key themes and opportunities we see in the current market environment. Please feel free to contact us if you would like to discuss these themes further or learn more about how we could help you meet your investment objectives.
1. U.S. Trade Policy Uncertainty Drives Sharp Drop in Consumer Confidence
The Trump administration’s policy decisions have significantly heightened uncertainty, especially around trade. This uncertainty has led to a drop in business investment and a collapse in consumer confidence in the U.S. and Canada. The risk-off sentiment has led to bond outperformance compared to equities, with the global investment grade bond index up 3.2% on the year, while the S&P 500 has fallen over 7%, officially entering correction territory.
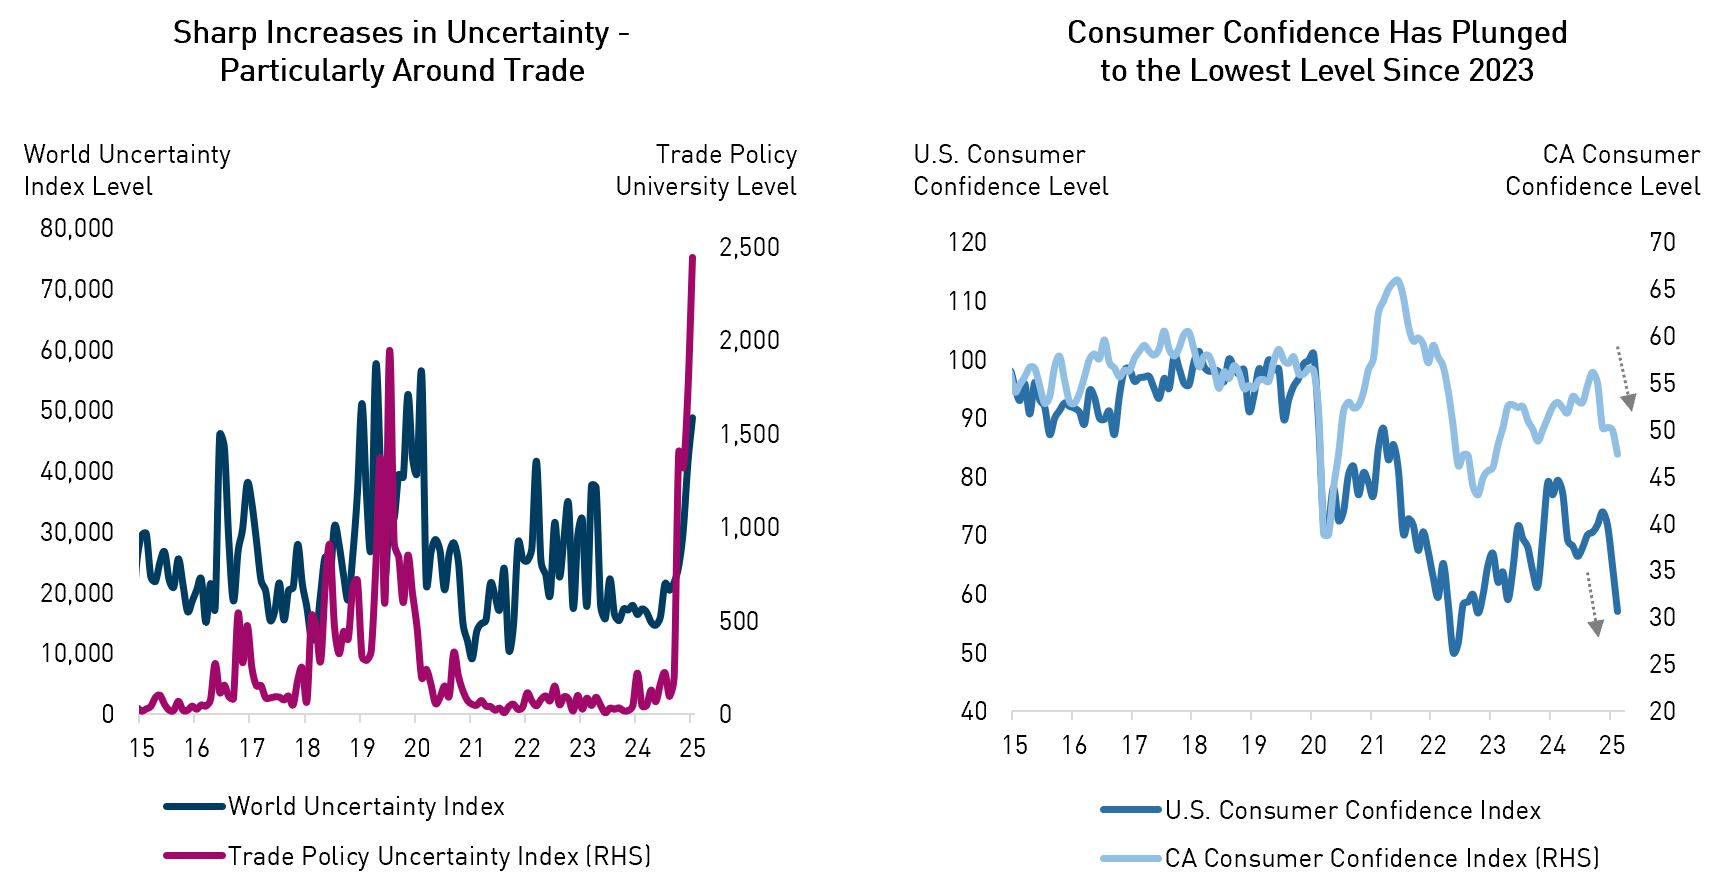
Source: Bloomberg, policyuncertaintyindex.com. Index returns as of April 3, 2025. Uncertainty Index data as of February 28, 2025; Consumer Confidence Index data as of March 31, 2025. Global investment grade bond index = Bloomberg Barclays Global Aggregate Corporate Bond Index; US Consumer Confidence Index = University of Michigan US Consumer Sentiment Index; CA Consumer Confidence Index = Canada Bloomberg Nanos Canadian Confidence Index.
2. Continued Divergence in U.S.-Canada Rate Path Due to Deteriorating Economic Outlooks and Trade Risks
The yield differential across the two regions continues to be larger than usual, given different economic outlooks and the asymmetry of what’s at stake when it comes to trade. Note that in the event of a “risk-off” scenario, we believe U.S. yields have more room to rally than Canadian yields, given the higher starting levels.
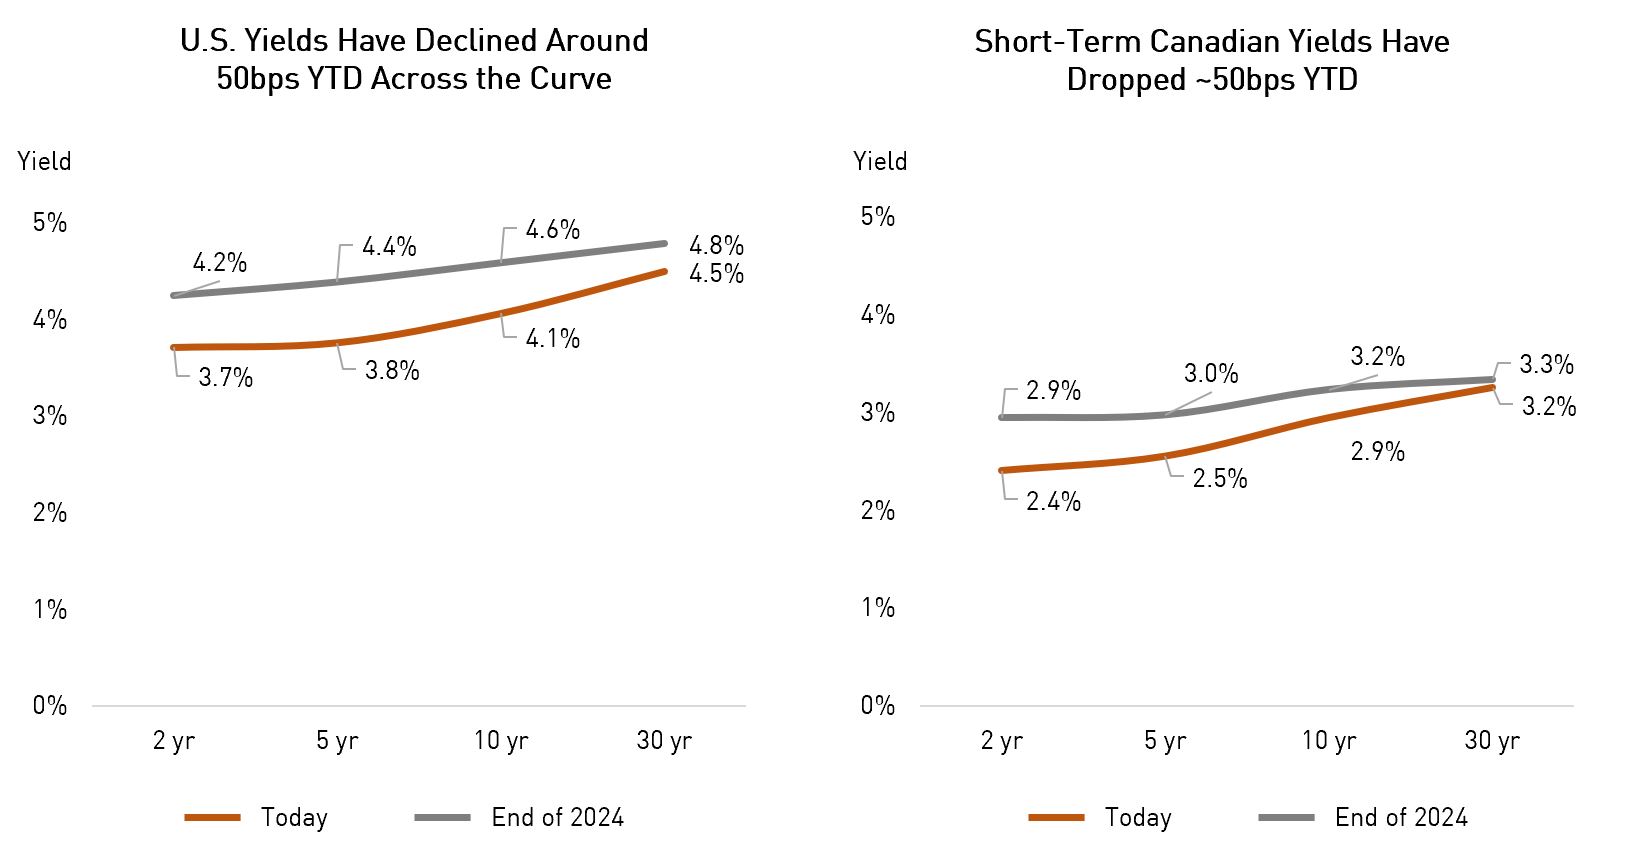
Source: Bloomberg. Data as of April 3, 2025.
3. Volume of M&A Activity Has Not Grown as Expected This Year
This stands in stark contrast to the elevated 2025 M&A estimates made at the end of last year. M&A activity is, at the margin, a key driver of U.S. investment grade (IG) issuance. A lower-than-expected number of deals this year would mean less IG bond supply than previously anticipated.
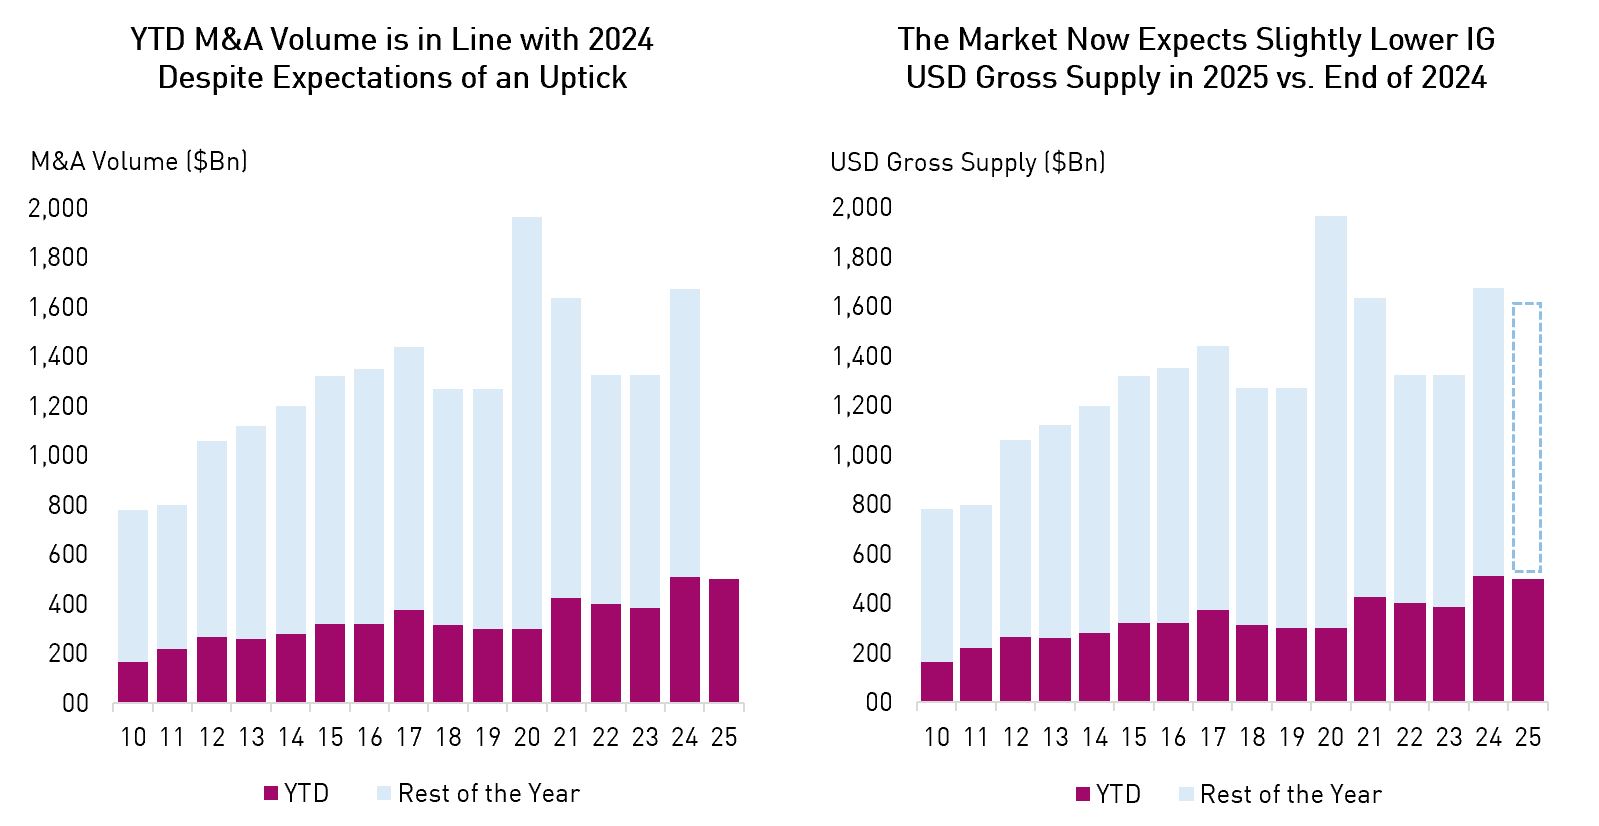
Source: Goldman Sachs. Data as of February 28, 2025.
4. Signs of Dispersion Emerge as Sectors Respond Differently to Tariff Threats
Dispersion is emerging as Trump’s policy measures take effect. Notably, credit spreads for industries most exposed to trade tariff risks – such as autos, retailers, materials, etc. – have experienced more pronounced widening. We are treading particularly cautiously in these tariff-sensitive segments of the market but monitoring fundamentals for opportunities where it makes sense to add exposure.
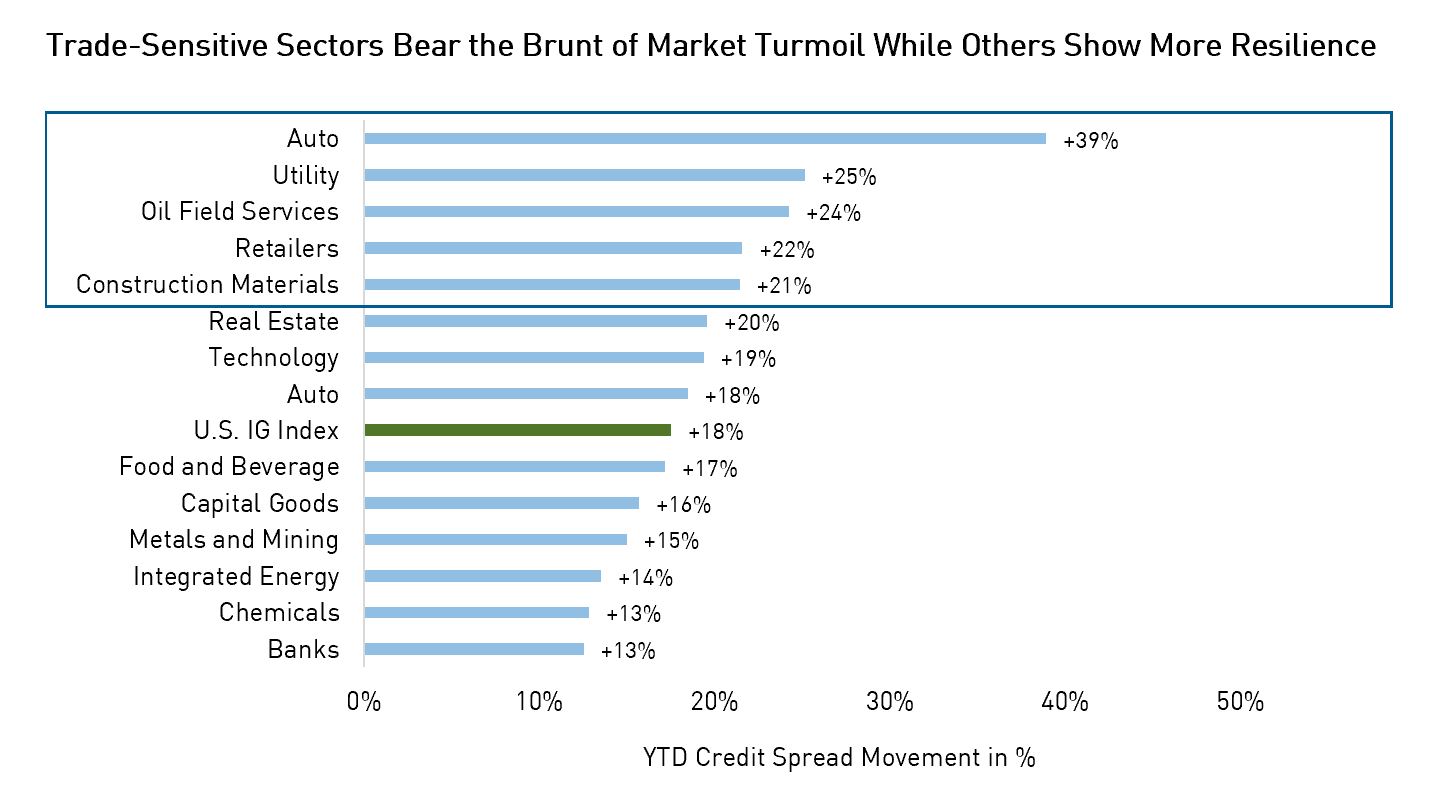
Source: BarclaysLive. Data as of March 31, 2025.
5. Credit Spreads Have Started to Decompress After a Long Period of Convergence
While the spread differential has risen, the yield premium offered by BB-rated U.S. issuers is not yet as wide as that seen in 2022. While we continue to favor defensive positioning, we may look to add BBs exposure selectively in certain mandates as valuations become more attractive.
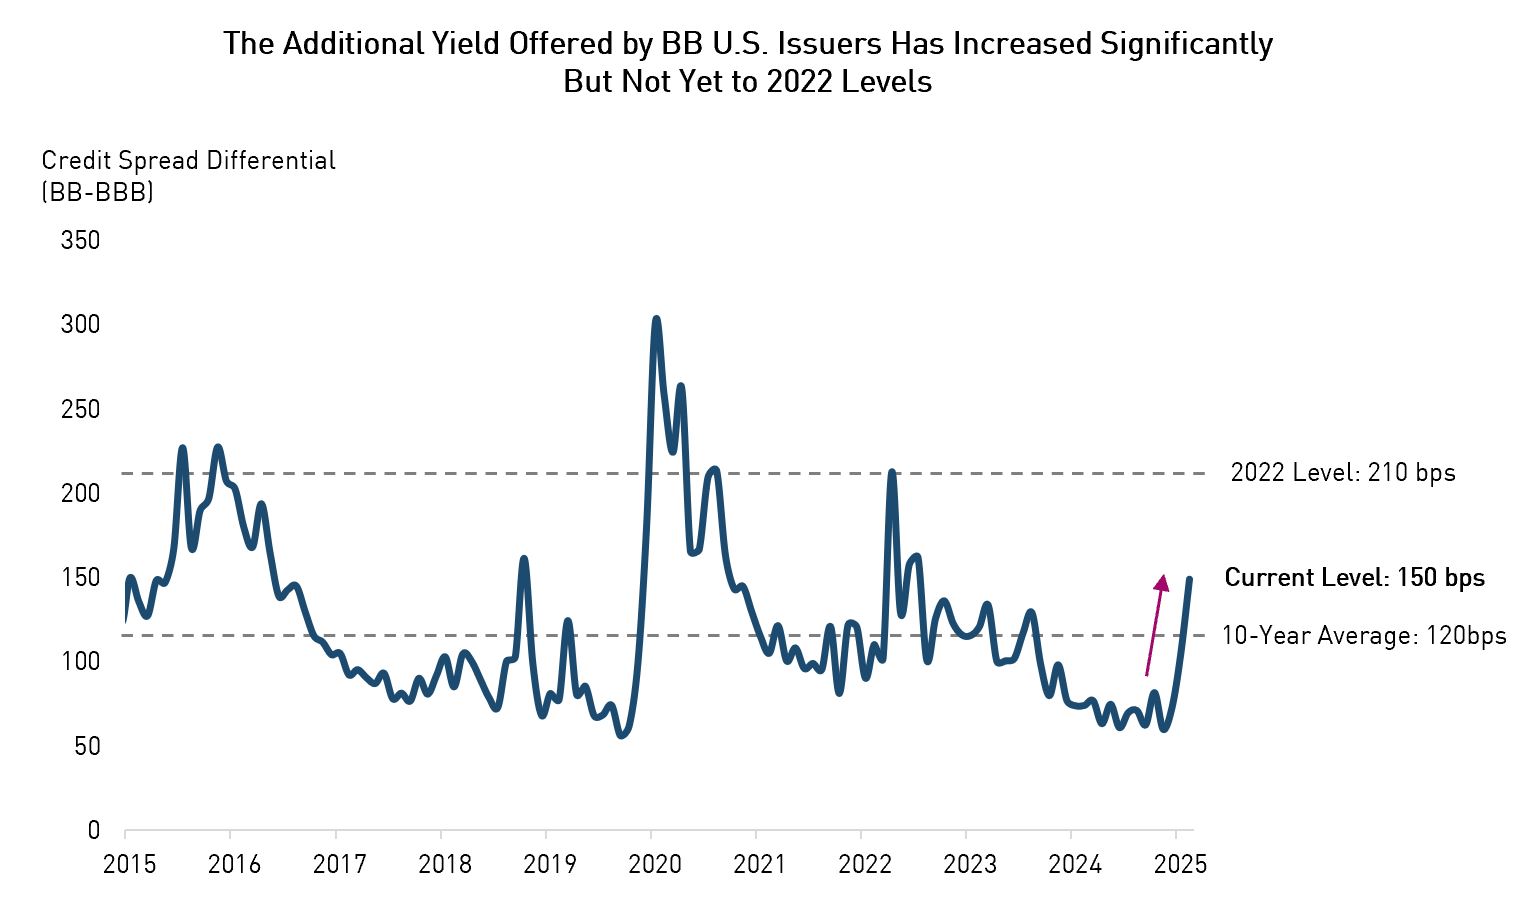
Source: BarclaysLive, Bloomberg. Data as of April 4, 2025.
Important Information
The information herein is presented by RP Investment Advisors LP (“RPIA”) and is for informational purposes only. It does not provide financial, legal, accounting, tax, investment, or other advice and should not be acted or relied upon in that regard without seeking the appropriate professional advice. The information is drawn from sources believed to be reliable, but the accuracy or completeness of the information is not guaranteed, nor in providing it does RPIA assume any responsibility or liability whatsoever. The information provided may be subject to change and RPIA does not undertake any obligation to communicate revisions or updates to the information presented. Unless otherwise stated, the source for all information is RPIA. The information presented does not form the basis of any offer or solicitation for the purchase or sale of securities. Products and services of RPIA are only available in jurisdictions where they may be lawfully offered and to investors who qualify under applicable regulation. RPIA managed strategies and funds carry the risk of financial loss. Performance is not guaranteed and past performance may not be repeated.
Commissions, trailing commissions, management fees and expenses all may be associated with mutual fund investments. Please read the prospectus before investing. Indicated rates of return include changes in share or unit value and reinvestment of all dividends or distributions and do not take into account sales, redemption, distribution or optional charges or income taxes payable by any securityholder that would have reduced returns. Returns for time periods of more than one year are historical annual compounded total returns while returns for time periods of one year or less are cumulative figures and are not annualized. Mutual funds are not guaranteed, their values change frequently and past performance may not be repeated. The compound growth chart is used only to illustrate the effects of a compound growth rate and is not intended to reflect future values or returns of the Fund.
The index performance comparisons presented are intended to illustrate the historical performance of the indicated strategies compared with that of the specified market index over the indicated period. The comparison is for illustrative purposes only and does not imply future performance. There are various differences between an index and an investment strategy or fund that could affect the performance and risk characteristics of each. Market indices are not directly investable and index performance does not account for fees, expense and taxes that might be applicable to an investment strategy or fund. “Forward-Looking” statements are based on assumptions made by RPIA regarding its opinion and investment strategies in certain market conditions and are subject to a number of mitigating factors. Economic and market conditions may change, which may materially impact actual future events and as a result RPIA’s views, the success of RPIA’s intended strategies as well as its actual course of conduct.