
Our Latest Market Updates
Twin Shocks: AI and Geopolitics - Q1 2026 Notes from the Trading Desk
Credit Market Themes in 5 Charts - Q1 2026
RP Select Opportunities
| 1 MON | 3 MON | 6 MON | YTD | 1 YR | 3 YR | 5 YR | 10 YR | Since Inception | |
|---|---|---|---|---|---|---|---|---|---|
| RP Select Opportunities Strategy | -2.67% | -1.96% | -1.20% | -1.96% | 2.49% | 8.21% | 6.29% | 8.32% | 7.67% |
Source: RPIA. Data as of 03/31/2026. SOF = RP Select Opportunities. SI = 04/2014. RP Select Opportunities strategy performance presented above is a hypothetical illustration based on the weighted average composite return of a separately managed account utilizing a similar strategy from inception in April 2014 to May 2014, then linked to the returns of RP Select Opportunities Cayman Fund Ltd. – Class C Lead.
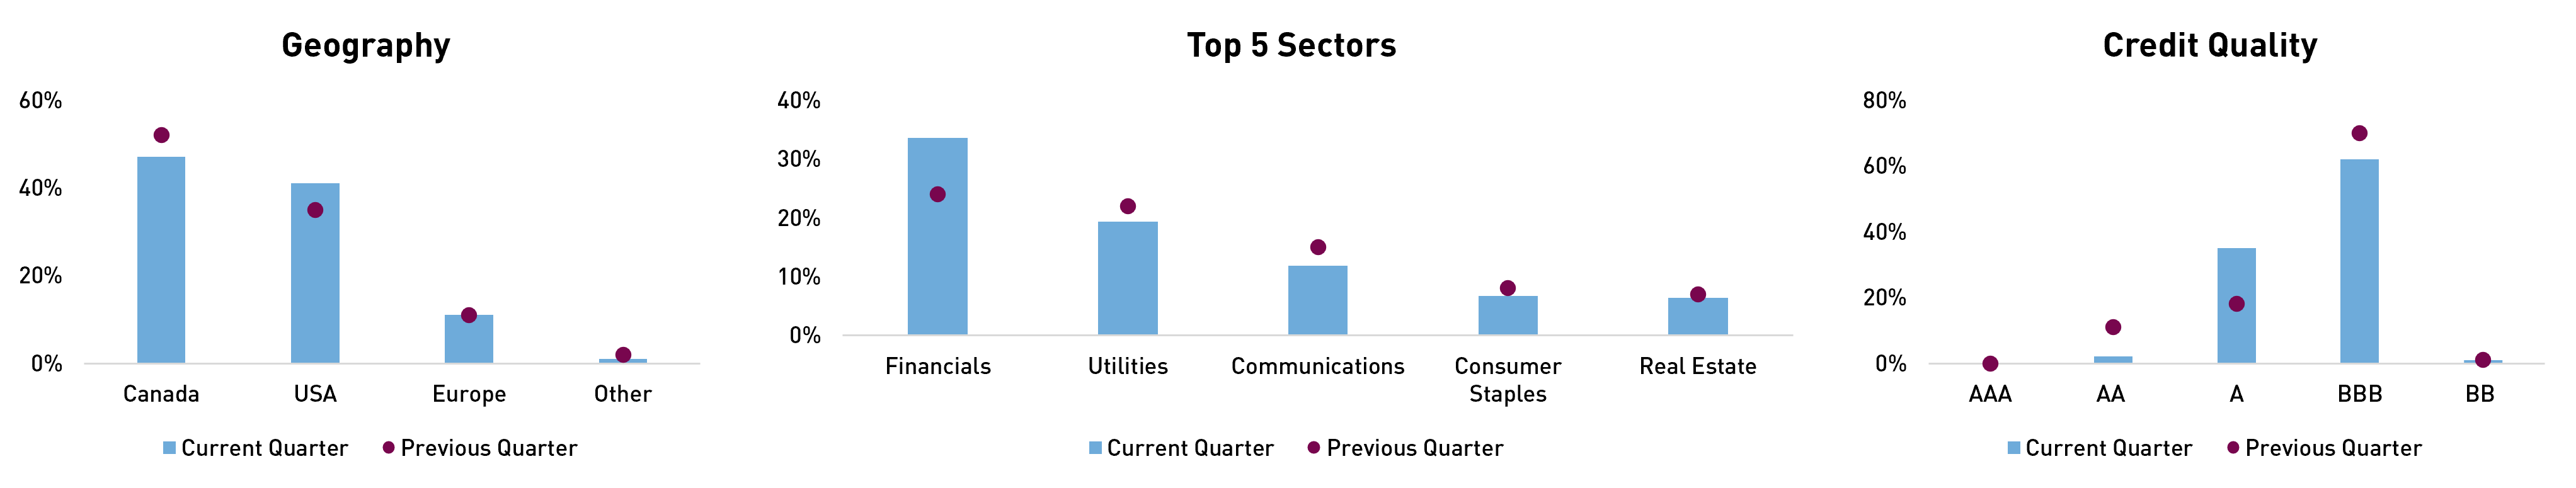
SOF returned -1.96% during the quarter despite elevated volatility as the portfolio’s macro hedges helped contain downside volatility amid widening credit spreads.
The Iran conflict dominated headlines in March, with uncertainty around the Strait of Hormuz driving a sharp increase in oil prices. This pushed inflation expectations higher and led to a 50-60 bps rise in overnight rates across Canada, the US, and Europe, alongside a broad upward shift in yield curves. Meanwhile, investor sentiment remained influenced by macro headlines, including AI-driven disruption and ongoing stresses in private credit markets, which spilled over into the technology and consumer sectors within public fixed income.
At the headline level, US investment-grade spreads remained relatively resilient, widening modestly by ~10 bps to 95 bps, supported by demand for higher-quality yield as supply headwinds subsided. In contrast, US high-yield spreads widened by ~15 bps to 330 bps, marking a third consecutive month of widening amid persistent outflows. Elevated M&A-driven issuance added pressure, resulting in the weakest monthly performance since 2023. Beneath the surface, dispersion increased as rising energy costs impacted issuer margins unevenly, with energy a notable area of strength.
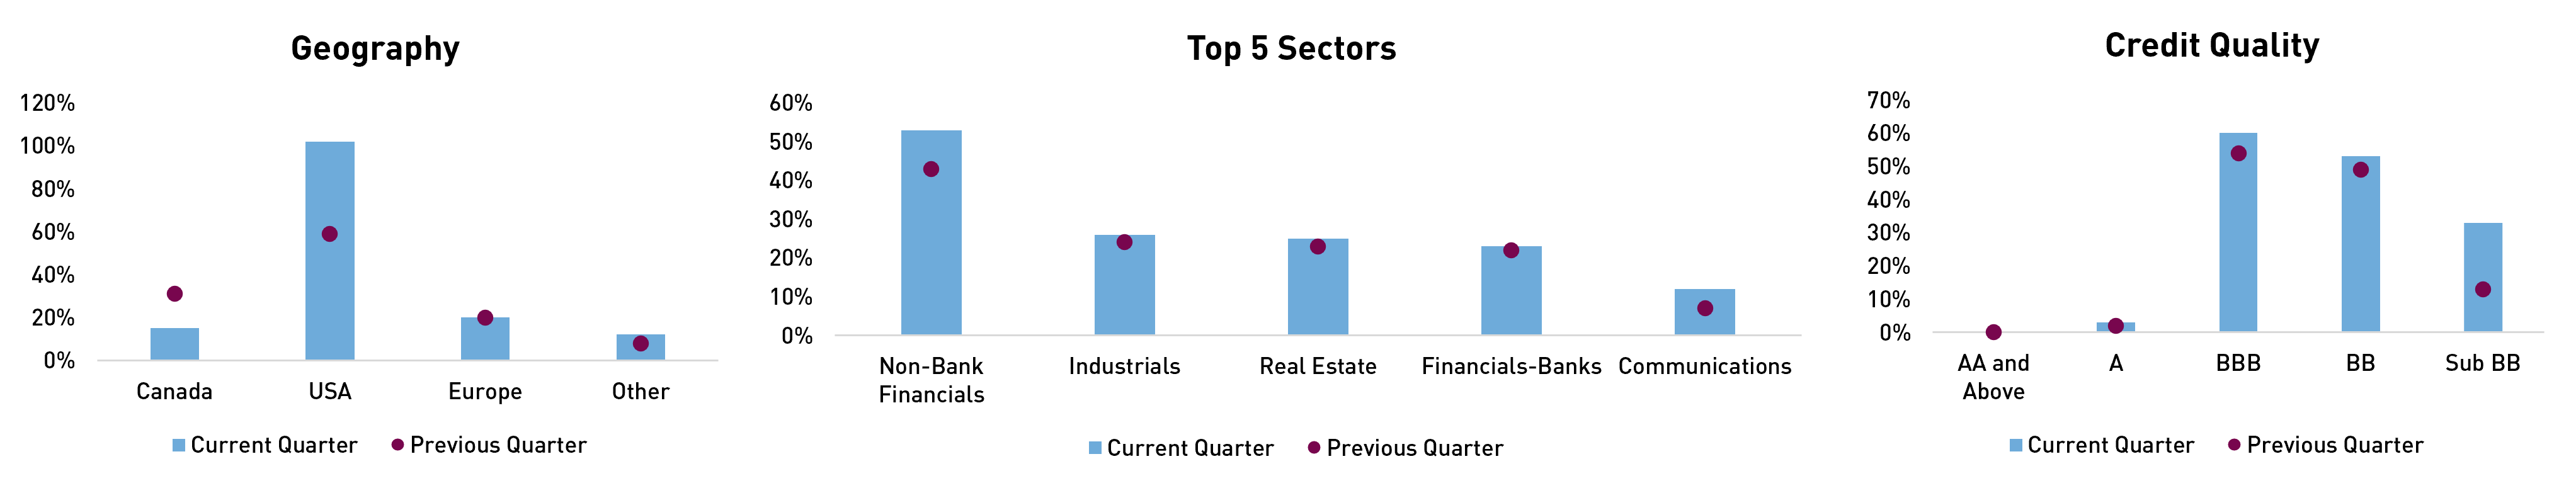
Against this backdrop, both long credit exposure and interest rate duration detracted from performance, with duration becoming a larger headwind toward quarter-end as yields moved higher. Credit hedges, primarily through high-yield CDX indices and equity index put options, performed well and partially offset losses, alongside gains from select CDS short positions. The portfolio’s up-in-quality bias, with over half of assets in investment-grade securities, proved advantageous as lower-quality segments underperformed.
High-conviction positions in the airline and commercial legal finance sectors experienced mark-to-market losses alongside the broader selloff. We used this dislocation to add at more attractive spread levels. The Fund also participated in elevated M&A and LBO issuance, including Electronic Arts, the largest LBO in history. Positions across USD and EUR tranches were monetized following strong secondary performance.
| Top Contributors to Credit Return (Sector) |
|---|
| Credit Hedges |
| Materials |
| Real Estate |
Source: RPIA. Data as of 3/31/2026.
| Top Contributors to Credit Return (Issuer) |
|---|
| CDX.NA.HY.45 12/30 |
| MPT Operating Partnership LP |
| Domtar Corp |
The portfolio reduced interest rate duration in late February as yields rallied prior to the escalation in geopolitical tensions. As In March, rate cuts were priced out and rate hikes were priced into Canadian and US markets. We have been increasing duration as the conflict persists, particularly in CAD and USD, based on the view that front-end yields are overreacting and that demand destruction, especially in Canada, will ultimately outweigh inflation-driven rate pressures. This positioning has led to some mark-to-market drawdown, but we maintain high conviction and continue to add CAD and USD duration on weakness. We remain cautious on UK and EUR duration, where energy-driven inflation risks could persist if the conflict continues. Overall portfolio duration increased from 2.9 years to 5.4 years by month-end.
On the credit side, we rebalanced the portfolio as high-yield dispersion remains elevated and tactical opportunities continue to emerge. This included further reducing higher-beta financial exposure while leaning into attractively priced new issues with potential for additional upside. We have also monetized portions of our hedges to preserve capital for future dislocations. At the same time, we are taking advantage of the reset in high-yield valuations to selectively add short-duration high-yield positions at more attractive levels.
Overall, the portfolio remains conservatively positioned while offering an attractive net yield of 6.9%. We believe the portfolio’s more conservative stance positions it well to capitalize on compelling opportunities as they arise. In the interim, we aim to continue providing investors with an effective alternative to traditional fixed income, equity, and private asset allocations.
| Q1 2026 | Q4 2025 | |
|---|---|---|
| Effective Duration (Years) | 5.4 | 4.0 |
| Credit Duration (Years) | 3.5 | 1.6 |
| Net Credit Leverage | 1.2x | 0.8x |
| % Rated Investment Grade | 52% | 48% |
Source: RPIA. Data as of 3/31/2026.
Source: RPIA. Data as of 3/31/2026.
RP Debt Opportunities
| 1 MON | 3 MON | 6 MON | YTD | 1 YR | 3 YR | 5 YR | 10 YR | Since Inception | |
|---|---|---|---|---|---|---|---|---|---|
| RP Debt Opportunities | -1.37% | -1.19% | -1.20% | -1.19% | 1.43% | 6.41% | 4.61% | 5.37% | 6.05% |
Source: RPIA. Data as of 03/31/2026. DOF = RP Debt Opportunities. SI = 10/2009. RP Debt Opportunities strategy performance presented above represents a composite return of RP Debt Opportunities Fund LP Class A and RP Debt Opportunities Fund Ltd. Class A, from October 2009 to July 2011 and RP Debt Opportunities Fund Ltd. Class A. from August 2011 onwards.
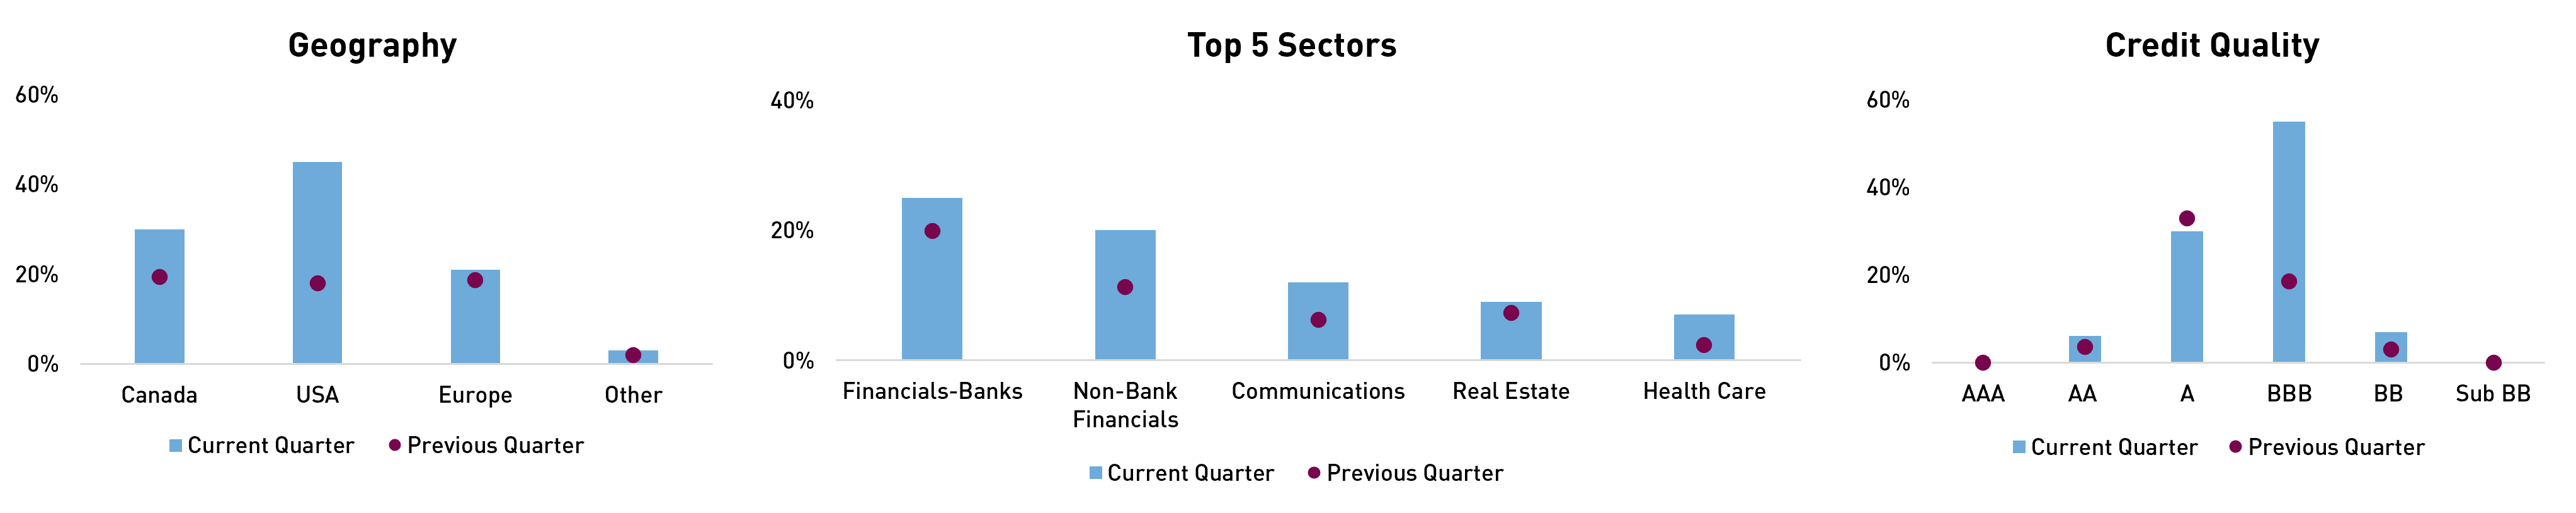
DOF returned -1.19% during the quarter, with gains from interest rate exposure partially offsetting mark-to-market losses associated with wider credit spreads.
Credit markets experienced a volatile quarter as strong technicals early in the period gave way to a more uncertain macro and geopolitical backdrop. January saw a risk-on tone supported by robust demand and record issuance that was easily absorbed. However, as the quarter progressed, weaker economic data, concerns around AI-driven disruption and private credit, and escalating geopolitical tensions contributed to broader credit spread widening and increased dispersion. By March, a sharp rise in energy prices and short-term inflation expectations drove higher risk-free yields and a more pronounced risk-off tone across markets.
Against this backdrop, both long credit exposures and interest rate duration acted as net detractors during the period, with the latter becoming a more meaningful headwind into quarter-end as yields moved sharply higher amid the escalation in the Middle East conflict. The Fund’s macro hedges and single-name short positions helped limit downside as index-level investment-grade spreads widened 10-20 bps across geographies.
From a credit perspective, select asset-backed security exposures were resilient and contributed positively despite broader market volatility. Energy infrastructure exposures were also a bright spot, with solid spread performance across the capital structure of Canadian issuers and select U.S. names. U.S. healthcare issuers contributed positively as well, led by participation in new issues from Amgen and AbbVie, which offered attractive concessions and performed well in the secondary market. These positions were actively monetized, with proceeds rotated into higher-quality healthcare exposures. While spreads widened across select technology and communications issuers, we remain confident in the underlying fundamentals and believe these bonds offer compelling relative and absolute value.
| Top Contributors to Credit Return (Sector) |
|---|
| Credit Hedges |
| Utilities |
| Healthcare |
Source: RPIA. Data as of 3/31/2026.
| Top Contributors to Credit Return (Issuer) |
|---|
| SPDR S&P 500 ETF TRUST |
| CDX.NA.IG.45 12/30 |
| HSBC Holdings PLC |
The portfolio tactically rotated interest rate duration in January and February as yields generally rallied prior to the escalation in geopolitical tensions. In March, the market moved from pricing rate cuts to pricing rate hikes in Canada. This moved front-end yields to very attractive levels, causing us to increase short-end Canadian rates exposure above the Fund’s historical average. The fund experienced modest mark-to-market pressure late in the quarter from this positioning, but our conviction in this trade over the medium term remains strong.
On the credit side, exposure remained relatively subdued versus historical averages, though the Fund tactically increased risk in January and participated in the risk-on environment supported by strong primary market activity and robust demand. As uncertainty increased, exposure was trimmed, and the portfolio reduced its already modest credit beta, focusing instead on idiosyncratic opportunities driven by greater sector dispersion.
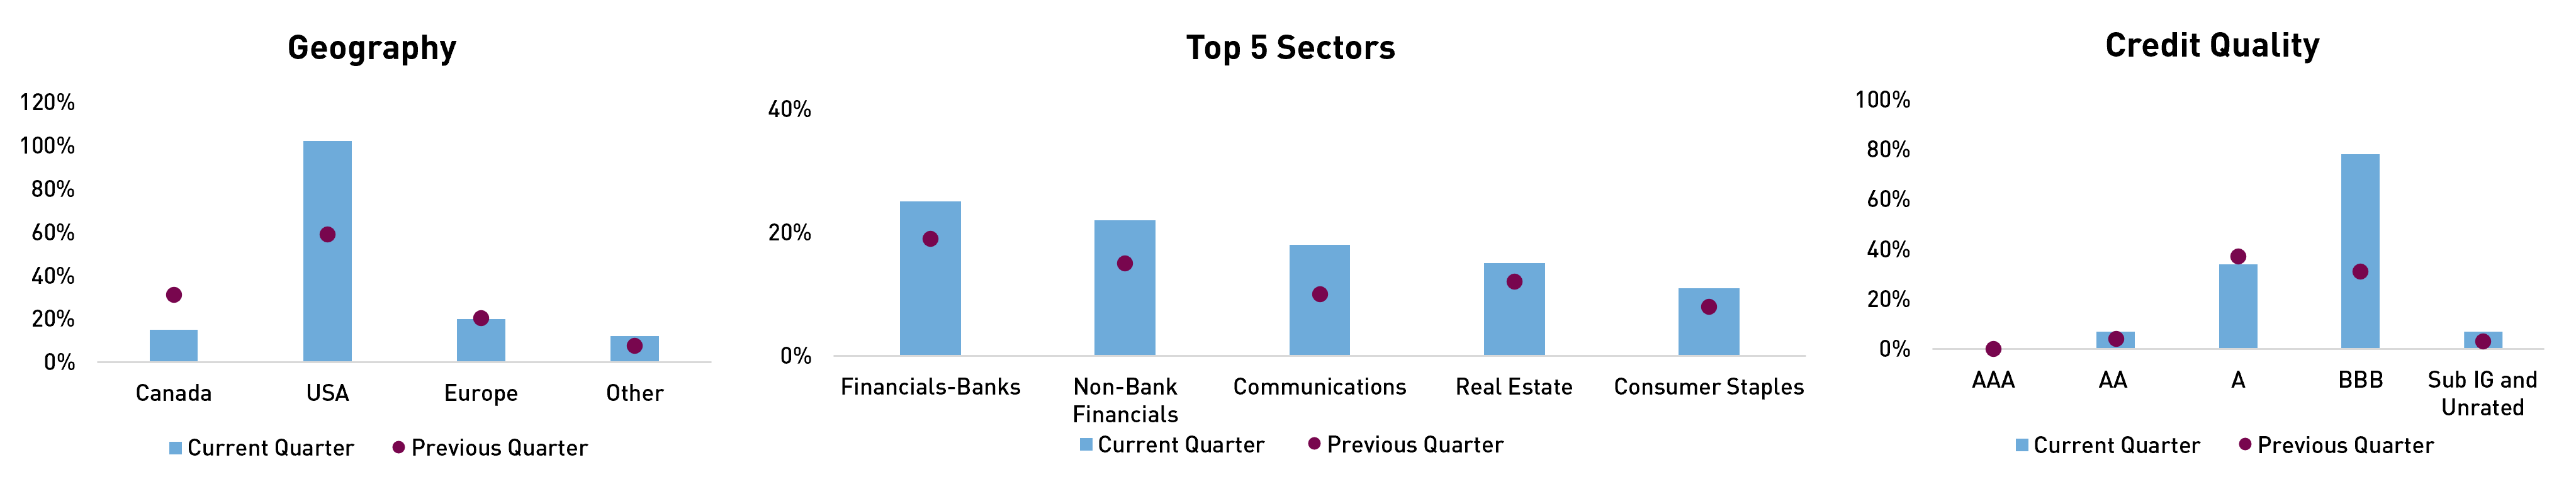
The portfolio continues to favour front-end interest rate exposure – particularly Canadian duration – while sourcing credit exposure primarily in high-conviction USD-denominated securities and short-dated investment-grade Canadian credit where spreads have become more attractive. Positioning is concentrated in high-quality financials and high-conviction TMT issuers, alongside selective single-name shorts in more vulnerable cyclical sectors. Overall portfolio quality remains high, with limited high-yield exposure, largely concentrated in hybrid securities issued by issuers rated investment grade at the senior level.
| Q1 2026 | Q4 2025 | |
|---|---|---|
| Effective Duration (Years) | 4.0 | 4.2 |
| Credit Duration (Years) | 5.2 | 0.8 |
| Net Credit Leverage | 1.2x | 0.2x |
| % Rated Investment Grade | 102% | 99% |
Source: RPIA. Data as of 3/31/2026.
Source: RPIA. Data as of 3/31/2026.
RP Fixed Income Plus
| 1 MON | 3 MON | 6 MON | YTD | 1 YR | 3 YR | 5 YR | 10 YR | Since Inception | |
|---|---|---|---|---|---|---|---|---|---|
| RP Fixed Income Plus | -1.08% | -0.13% | 0.21% | -0.13% | 2.73% | 4.54% | 2.81% | 2.60% | 3.58% |
| FTSE Canada Universe Short-Term Bond Index | -0.89% | 0.26% | 0.58% | 0.26% | 2.41% | 4.32% | 2.02% | 2.04% | 2.32% |
| Added Value | -0.19% | -0.39% | -0.37% | -0.39% | +0.32% | +0.22% | +0.79% | +0.56% | +1.26% |
Source: RPIA. FTSE Russell. Data as of 3/31/2026 and annualized for periods greater than one year. SI = 07/2010. RP Fixed Income Plus strategy performance presented above represents a weighted-average composite return of separately managed accounts utilizing a similar strategy from inception in July 2010 to April 2013 and linked to the returns of the RP Fixed Income Plus Fund, Series A thereafter.
FIP returned -0.13% during the quarter, modestly lower than the FTSE Canada Universe Short-Term Bond Index (the “Index”).
In March, short-term yields rose by 40–50 bps across the US, Canada, and Europe. The Index experienced a similar dynamic during the month, with nearly the entire drawdown driven by rates. Despite the broader decline, the safest part of the portfolio, i.e., bankers’ acceptances, continued to provide uncorrelated, cash-like returns, helping to cushion a portion of the losses.
| Top Contributors to Credit Return (Sector) |
|---|
| Energy |
| Utilities |
| Technology |
Source: RPIA. Data as of 3/31/2026.
| Top Contributors to Credit Return (Issuer) |
|---|
| Toronto Dominion Bank/The |
| Inter Pipeline LTD/AB |
| Gildan Activewear Inc. |
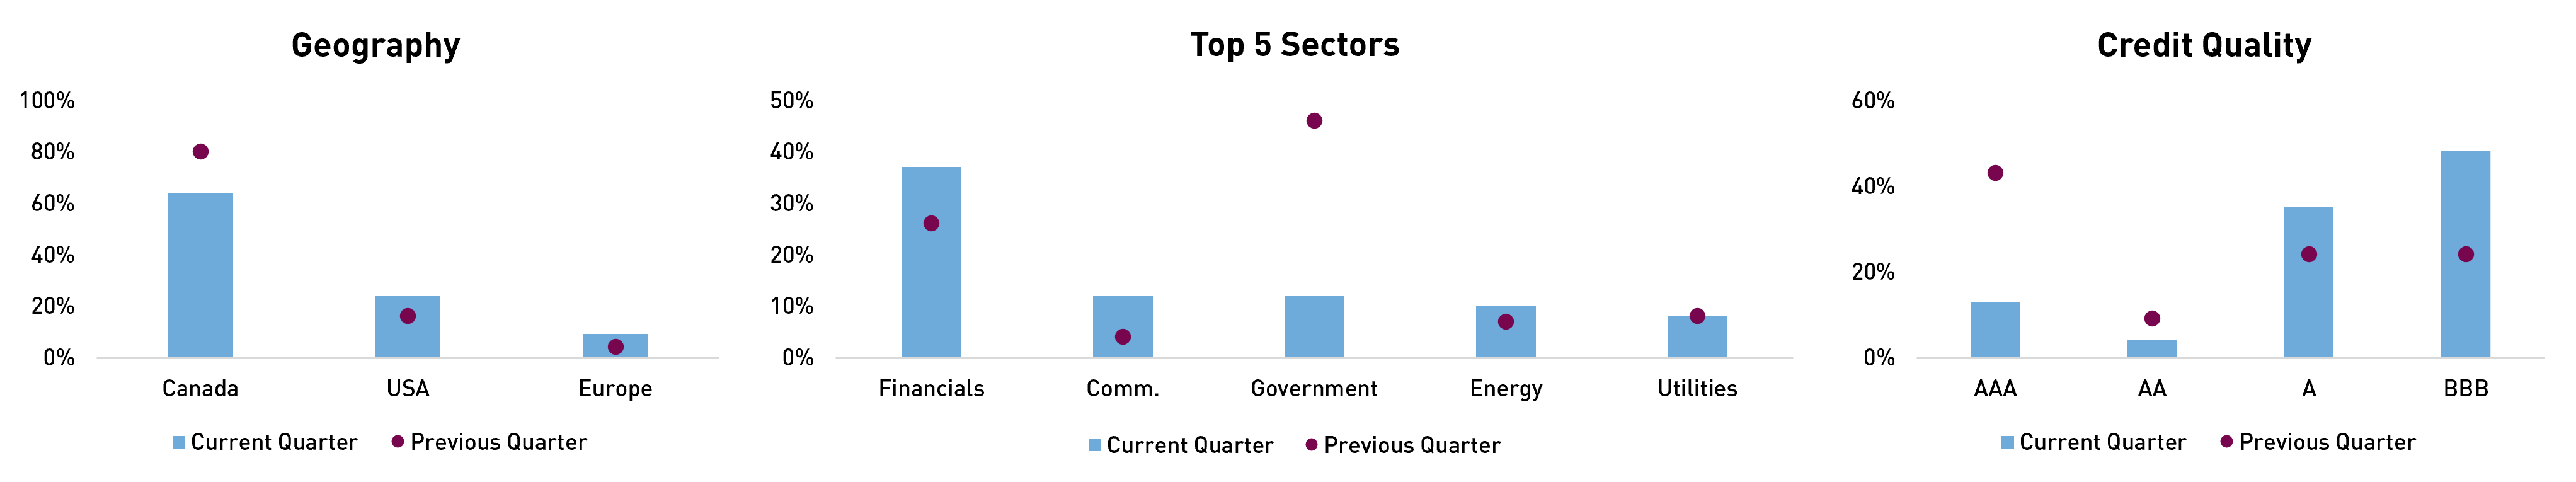
The portfolio entered the month with a moderate level of risk exposure, with duration at 2.6 years and credit duration at 2.7 years. Over the course of the month, we incrementally increased duration exposure as short-end yields moved higher - particularly in Canada, where we see the upward move as punitive and unjustified - ending the month at 2.9 years. Approximately 2/3s of the fund’s total interest rate exposure is sourced from CAD-denominated securities.
We maintained a similar level of overall credit exposure throughout the month but took the opportunity to rebalance within sectors. Specifically, we reduced exposure to Canadian energy and utilities, redeploying proceeds into areas where we have higher conviction, such as US financials and Canadian communications. From a credit perspective, we continue to prefer USD-denominated issuers, as the deeper and more liquid US market offers a broader set of idiosyncratic opportunities. The strategy remains well diversified across sectors. The portfolio’s yield has reset meaningfully, ending the month at 4.0% - nearly 60 bps higher than a month ago and more than 30 bps above the Index.
| Q1 2026 | Q4 2025 | |
|---|---|---|
| Effective Duration (Years) | 2.9 | 2.8 |
| Credit Duration (Years) | 2.7 | 1.7 |
| Average Term (Years) | 3.3 | 3.1 |
| % Rated Investment Grade | 100% | 100% |
Source: RPIA. Data as of 3/31/2026.
Source: RPIA. Data as of 3/31/2026.
RP Yield Advantage Fund
| 1 MON | 3 MON | 6 MON | YTD | 1 YR | Since Inception | |
|---|---|---|---|---|---|---|
| RP Yield Advantage Fund | -0.88% | -0.24% | 0.46% | -0.24% | 2.99% | 3.58% |
Source: RPIA. Data as of 3/31/2026. SI = 08/2023.
YAF returned -0.24% during the quarter.
In March, short-term yields rose by 40–50 bps across the US and Europe, where ~90% of the strategy exposure resides. The short-term bond index experienced a similar dynamic during the month, with nearly the entire drawdown driven by rates.
| Top Contributors to Credit Return (Sector) |
|---|
| Consumer Discretionary |
| Communications |
| Real Estate |
Source: RPIA. Data as of 3/31/2026.
| Top Contributors to Credit Return (Issuer) |
|---|
| Volkswagen Financial Services AG |
| Comcast Corp. |
| BPCE SA |
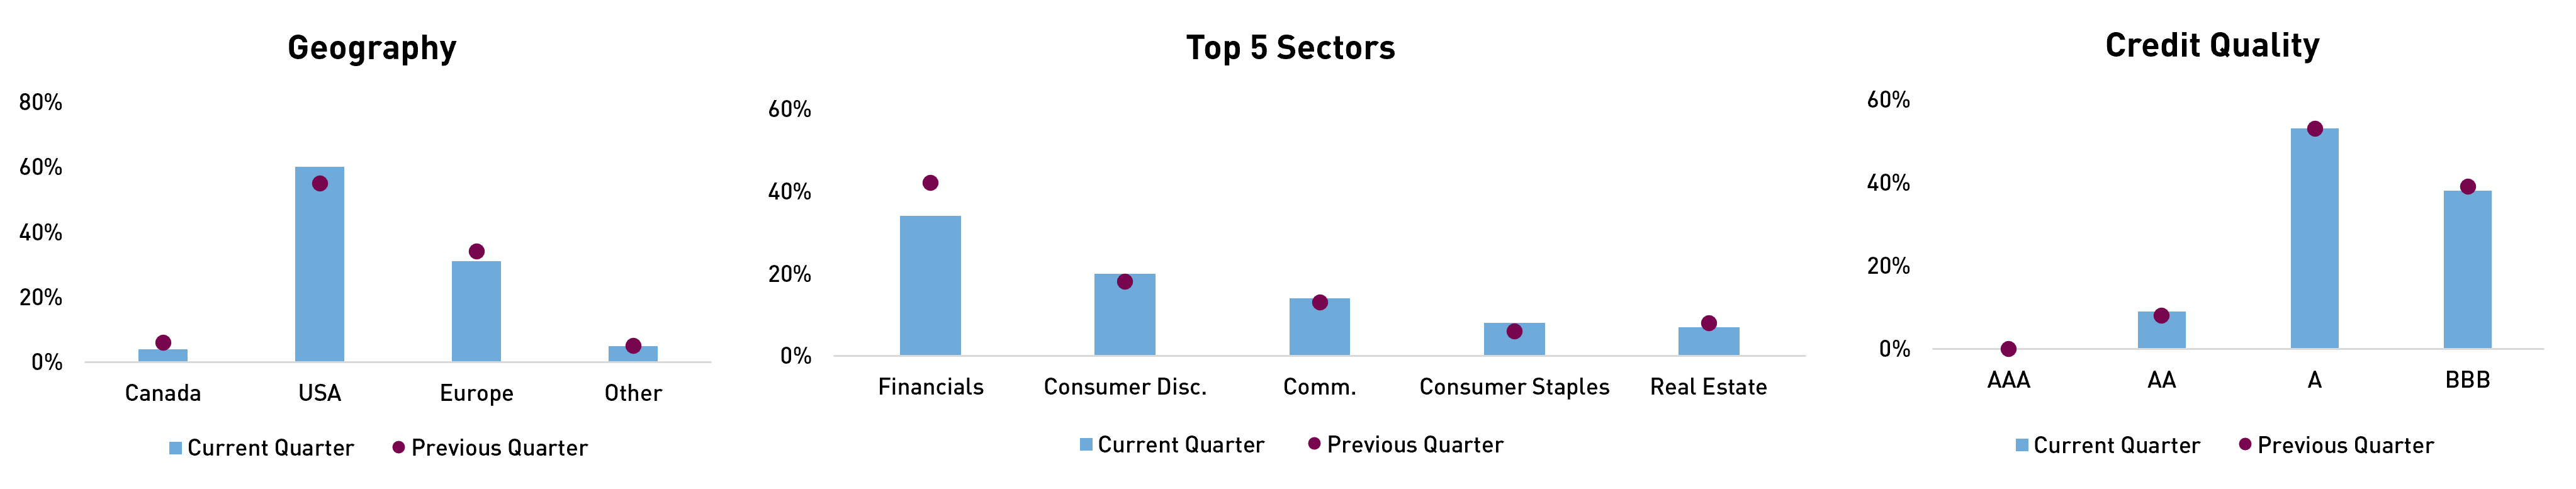
The strategy does not actively position for interest rate duration and maintained an interest rate and credit duration profile of approximately 1.9 years throughout the month. Credit risk exposure is primarily derived from European and U.S. issuers, where bonds continue to trade at notable discounts to par value, on average of $94.
Sector allocation remains well diversified. During the month, we modestly rebalanced the portfolio by trimming select financial holdings and adding discounted bonds from high-conviction names, particularly as dispersion has increased within healthcare and consumer staples issuers. The portfolio maintains an up-in-quality bias, with more than 60% of credit exposure allocated to A-rated and higher issuers.
Currently, the portfolio yields approximately 3.3% on a CAD-hedged basis, which translates to an income-equivalent yield of about 4.8% - meaningfully higher than the ~3.0% GIC rates offered by major banks at the moment.
| Q1 2026 | Q4 2025 | |
|---|---|---|
| Effective Duration (Years) | 1.9 | 1.9 |
| Credit Duration (Years) | 1.9 | 1.9 |
| Average Term (Years) | 1.9 | 1.7 |
| % Rated Investment Grade | 100% | 100% |
| GIC-Equivalent Yield | 4.7% | 4.2% |
Source: RPIA. Data as of 3/31/2026. GIC-Equivalent Yield is estimated internally. It is not the same as the portfolio’s actual return and is estimated as the before-tax return with tax rates based on a 50% inclusion rate. Personal tax rates are assumed to be 53.53% on interest income and 26.76% on capital gains. Investor level after tax returns will differ based on unique circumstances. Always consult your qualified tax professional for advice.
Source: RPIA. Data as of 3/31/2026.
RP Strategic Income Plus Fund
| 1 MON | 3 MON | 6 MON | YTD | 1 YR | 3 YR | 5 YR | Since Inception | |
|---|---|---|---|---|---|---|---|---|
| RP Strategic Income Plus Fund (Class F) | -1.85% | -0.72% | -0.92% | -0.72% | 1.56% | 4.53% | 2.43% | 3.62% |
Source: RPIA. Data as of 3/31/2026. STIP Class F = RP Strategic Income Plus Fund Class F (RPD110). SI = 04/2016.
STIP returned -0.72% during the quarter amid elevated volatility across interest rates and credit spreads.
Credit markets experienced a volatile quarter as strong technicals early in the period gave way to a more uncertain macro and geopolitical backdrop. January saw a risk-on tone supported by robust demand and record issuance that was easily absorbed. However, as the quarter progressed, weaker economic data, concerns around AI-driven disruption and private credit, and escalating geopolitical tensions contributed to broader credit spread widening and increased dispersion. By March, a sharp rise in energy prices and short-term inflation expectations drove higher risk-free yields and a more pronounced risk-off tone across markets.
Against this backdrop, the Fund’s performance was driven primarily by credit spread widening. Interest rate exposure provided a cushion through much of the quarter as government bond yields declined, partially offsetting credit losses. However, this dynamic reversed into quarter-end, as yields moved sharply higher and rate exposure became a detractor.
From a credit perspective, high-conviction CAD-denominated energy infrastructure issuers were key contributors, including positions in Maple bonds of Électricité de France, alongside active trading within Keyera and BPC Generation Infrastructure Trust debt stacks. US healthcare issuers also contributed positively, led by participation in new issues from Amgen and AbbVie, which offered attractive new issue concessions and performed well in the secondary market. These positions were actively monetized, with proceeds rotated into higher-quality healthcare exposures. While spreads in select technology and communications issuers widened during the period, the investment team remains confident in the underlying fundamentals of these holdings and believes the bonds offer compelling relative and absolute value.
| Top Contributors to Credit Return (Sector) |
|---|
Utlities |
Energy |
| Healthcare |
Source: RPIA. Data as of 3/31/2026.
| Top Contributors to Credit Return (Issuer) |
|---|
| Electricite de France SA |
| Foundry JV HoldCo LLC |
| Amgen Inc. |
The portfolio reduced interest rate duration in February alongside the rally in yields prior to the escalation in geopolitical tensions. More recently, duration was increased as yields and short-term capital gain opportunities reached attractive entry points. We are well convicted in this positioning in the medium-term, however, it did contribute to modest mark-to-market pressure late in the quarter.
On the credit side, exposure remained relatively subdued early in the period before increasing following the widening in spreads. The portfolio reduced government-related holdings in favour of selectively adding to high-quality credit, particularly within high-quality CAD- and USD-denominated financial issuers, where valuations became more compelling. Overall portfolio quality remains high, as we continue to favour investment-grade credit and believe current valuations do not adequately compensate for moving down the credit spectrum.
| Q1 2026 | Q4 2025 | |
|---|---|---|
| Effective Duration (Years) | 6.6 | 5.7 |
| Credit Duration (Years) | 5.9 | 3.4 |
| % Rated Investment Grade | 99% | 99% |
Source: RPIA. Data as of 3/31/2026.
Source: RPIA. Data as of 3/31/2026.
RP Alternative Global Bond Fund
| 1 MON | 3 MON | 6 MON | YTD | 1 YR | 3 YR | 5 YR | Since Inception | |
|---|---|---|---|---|---|---|---|---|
| RP Alternative Global Bond Fund (Class F) | -1.50% | -1.26% | -1.21% | -1.26% | 2.56% | 7.62% | 5.16% | 5.99% |
Source: RPIA. Data as of 3/31/2026. AGB Class F = RP Alternative Global Bond Fund Class F (RPD210). SI = 07/2019.
AGB returned -1.26% during the quarter amid elevated volatility across interest rates and credit spreads.
Credit markets experienced a volatile quarter as strong technicals early in the period gave way to a more uncertain macro and geopolitical backdrop. January saw a risk-on tone supported by robust demand and record issuance that was easily absorbed. However, as the quarter progressed, weaker economic data, concerns around AI-driven disruption and private credit, and escalating geopolitical tensions contributed to broader credit spread widening and increased dispersion. By March, a sharp rise in energy prices and short-term inflation expectations drove higher risk-free yields and a more pronounced risk-off tone across markets.
Against this backdrop, both long credit exposures and interest rate duration acted as net detractors during the period, with the latter becoming a more meaningful headwind into quarter-end as yields moved sharply higher amid the escalation in the Middle East conflict. The Fund’s macro hedges and single-name short positions helped limit downside as index-level investment-grade spreads widened 10-20 basis points across geographies.
From a credit perspective, select asset-backed security exposures were resilient and contributed positively despite broader market volatility. Energy infrastructure exposures were also a bright spot, with solid spread performance across the capital structure of Canadian issuers and select U.S. names. U.S. healthcare issuers contributed positively as well, led by participation in new issues from Amgen and AbbVie, which offered attractive concessions and performed well in the secondary market. These positions were actively monetized, with proceeds rotated into higher-quality healthcare exposures. While spreads widened across select technology and communications issuers, we remain confident in the underlying fundamentals and believe these bonds offer compelling relative and absolute value.
| Top Contributors to Credit Return (Sector) |
|---|
| Credit Hedges |
| Utlities |
| Asset-Backed Securities |
Source: RPIA. Data as of 3/31/2026.
| Top Contributors to Credit Return (Issuer) |
|---|
| State Street SPDR S&P 500 ETF Trust |
| CDX.NA.IG.45 12/30 |
| CDX.ITRX.44 12/30 |
The portfolio tactically rotated interest rate duration in January and February as yields generally rallied prior to the escalation in geopolitical tensions. In March, the market moved from pricing rate cuts to pricing rate hikes in Canada. This moved front-end yields to very attractive levels, causing us to increase short-end Canadian rates exposure above the Fund’s historical average. The Fund experienced modest mark-to-market pressure late in the quarter from this positioning, but our conviction in this trade over the medium term remains strong.
On the credit side, exposure remained relatively subdued versus historical averages, though the Fund tactically increased risk in January and participated in the risk-on environment supported by strong primary market activity and robust demand. As uncertainty increased, exposure was trimmed, and the portfolio reduced its already modest credit beta, focusing instead on idiosyncratic opportunities driven by greater sector dispersion.
The portfolio continues to favour front-end interest rate exposure – particularly Canadian duration – while sourcing credit exposure primarily in high-conviction USD-denominated securities and short-dated investment-grade Canadian credit where spreads have become more attractive. Positioning is concentrated in high-quality financials and high-conviction TMT issuers, alongside selective single-name shorts in more vulnerable cyclical sectors. Overall portfolio quality remains high, with limited high-yield exposure, largely concentrated in hybrid securities issued by issuers rated investment grade at the senior level.
| Q1 2026 | Q4 2025 | |
|---|---|---|
| Effective Duration (Years) | 4.8 | 5.7 |
| Credit Duration (Years) | 4.9 | 0.9 |
| Net Credit Leverage | 0.9x | 0.2x |
| % Rated Investment Grade | 96% | 96% |
Source: RPIA. Data as of 3/31/2026.
Source: RPIA. Data as of 3/31/2026.
RP Alternative Credit Opportunities Fund
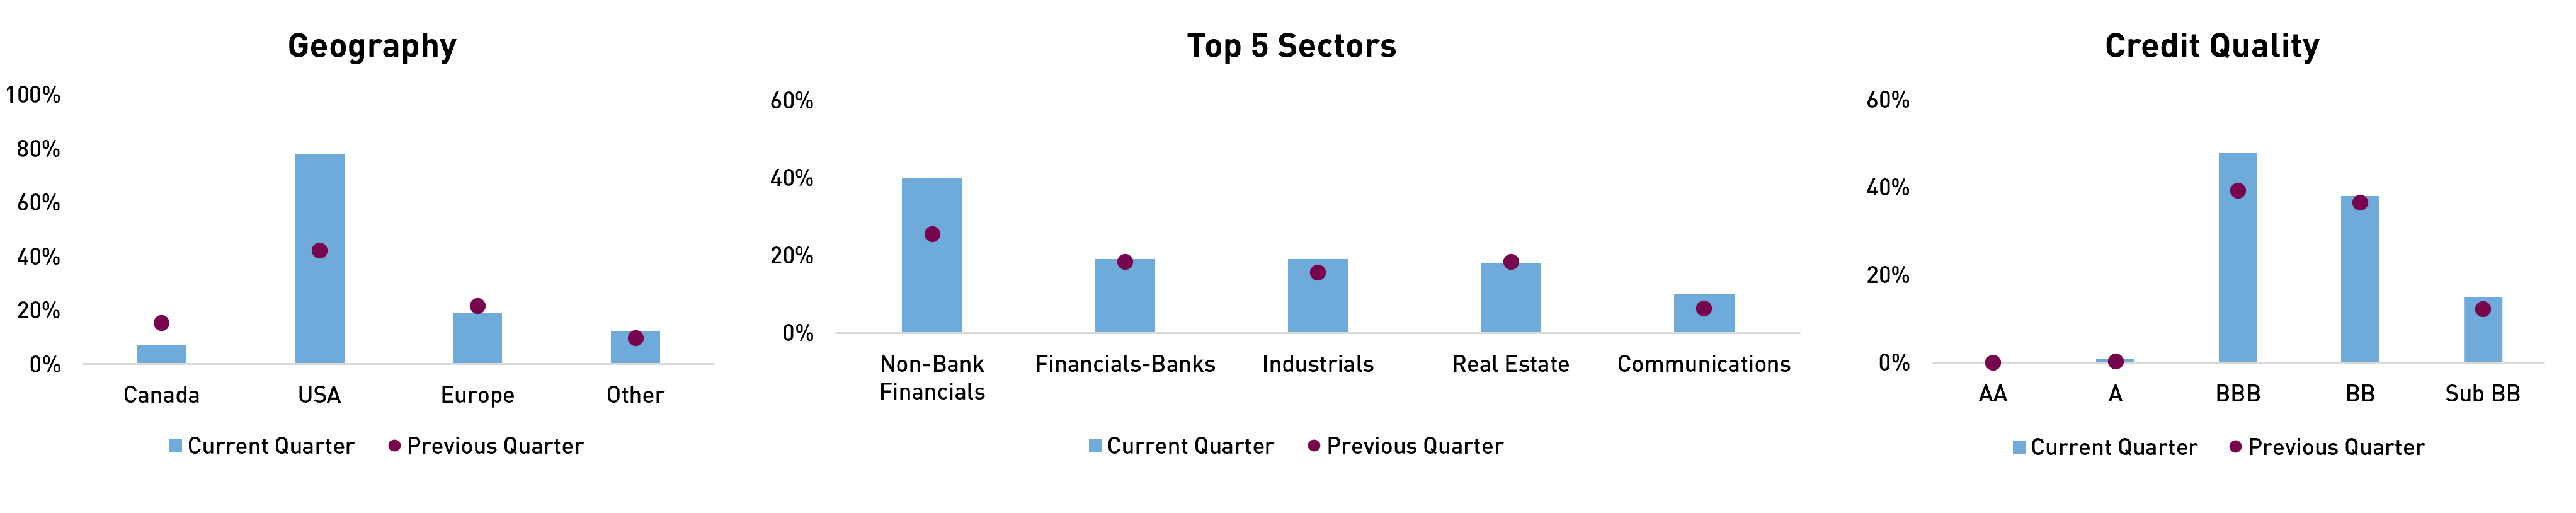
High-yield markets faced a challenging quarter, with spreads widening more than 80 bps from local tights to wides amid a combination of AI-related disruption and private credit contagion concerns, coupled with broader macro uncertainty. February and March were particularly weak, as rising geopolitical tensions drove higher energy prices, increased inflation uncertainty, and a sharp sell-off in risk-free yields. Simultaneously, heavy M&A-driven issuance and persistent outflows created additional headwinds, resulting in the weakest 1-month performance for USD high-yield markets since 2023. Dispersion across sectors and ratings was pronounced, with energy the primary area of strength supported by higher oil prices.
Against this backdrop, the Fund’s gains from select credit positions and hedging activity were offset by broad weakness across high-yield credit markets. Both long credit exposures and interest rate duration acted as net detractors during the period, with the latter becoming a more meaningful headwind into quarter-end as yields moved sharply higher. The Fund’s macro hedges and single-name short positions helped limit downside amid the broad selloff.
From a credit perspective, energy-related exposures were a bright spot, benefiting from supportive commodity dynamics. The Fund’s position in Heavy Metal Equipment – a specialized provider of ultra-class mining equipment serving investment-grade Canadian oil sands operators – realized significant spread compression relative to Canadian B-rated peers.
The Fund also actively participated in elevated M&A and LBO-related issuance, including Electronic Arts (the largest LBO in history) and Nexstar Media Group’s acquisition of Tegna. These transactions were well absorbed, but represented some of the largest high-yield supply since 2021 and contributed to broader market weakness during the quarter. The portfolio participated across both USD- and EUR-denominated tranches of the Electronic Arts financing and quickly monetized positions following strong secondary market performance. The Fund was also an active participant in the Nexstar transaction and continues to hold the position, which has performed well and has traded more constructively into the second quarter.
While several high-yield financial exposures detracted during the period amid broader spread widening, the portfolio selectively added to high-conviction positions at more attractive valuations, reflecting increased dispersion across sectors and issuers.
| Top Contributors to Credit Return (Sector) |
|---|
| Credit Hedges |
| Consumer Discretionary |
| Energy |
Source: RPIA. Data as of 3/31/2026.
| Top Contributors to Credit Return (Issuer) |
|---|
| CDX.NA.HY.45 12/30 |
| State Street SPDR S&P 500 ETF Trust |
| Heavy Metal Equipment & Rentals |
The portfolio reduced interest rate duration in late February as yields rallied prior to the escalation in geopolitical tensions. In March, rate cuts were priced out, and rate hikes were priced into Canadian and US markets. We used this opportunity to add duration exposure, primarily by reducing rate hedges to capture higher all-in yields. While we have high conviction in this exposure in the medium-term, it contributed to modest mark-to-market pressure late in the quarter.
On the credit side, the portfolio remains focused on USD-denominated opportunities, reflecting the greater uncertainty across European markets amid the prevailing energy shock. Overlay hedges were partially monetized following strong performance, though they remain a vital component of the portfolio given ongoing macro uncertainty. The Fund continues to maintain an up-in-quality bias relative to passive high-yield strategies, with nearly 50% allocated to investment-grade exposures and high-yield positioning concentrated in shorter-dated, higher-quality BB-rated securities. We believe the portfolio’s more conservative stance positions it well to capitalize on compelling opportunities as they arise. In the interim, we aim to continue providing investors with an effective alternative to traditional fixed income, equity, and private asset allocations.
| Q1 2026 | Q4 2025 | |
|---|---|---|
| Effective Duration (Years) | 3.8 | 2.9 |
| Credit Duration (Years) | 3.2 | 1.9 |
| Average Term (Years) | 4.0 | 3.9 |
| Net Credit Leverage | 1.0x | 0.6x |
| % Rated Investment Grade | 46% | 45% |
Source: RPIA. Data as of 3/31/2026.
Source: RPIA. Data as of 3/31/2026.