
Our Latest Market Updates
Hot and Cold - Q2 2025 Notes from the Trading Desk
Credit Market Themes in 5 Charts - Q2 2025
RP Strategic Income Plus Fund
| 1 MON | 3 MON | 6 MON | YTD | 1 YR | 3 YR | 5 YR | Since Inception | |
|---|---|---|---|---|---|---|---|---|
| RP Strategic Income Plus Fund (Class F) | 0.93% | 0.58% | 2.33% | 2.33% | 6.15% | 5.25% | 3.38% | 3.81% |
| FTSE Canada All Corporate Bond Index | 0.29% | 0.45% | 2.28% | 2.28% | 8.15% | 6.27% | 1.69% | 3.07% |
Source: RPIA, FTSE Russell. Data as of 06/30/2025 and annualized for periods greater than one year. SI = 04/2016.
STIP gained +0.58% during the quarter, outperforming the FTSE Canada All Corporate Bond Index (the “Index”).
The Fund generated positive returns from credit spreads and limited the negative impact from the selloff in Canadian interest rates. Given the underperformance of domestic rates and steepening of yield curves, the portfolio’s US duration and bias for front-end exposures contributed to relative outperformance versus the Index. Credit returns were driven by spread compression in domestic and French energy-infrastructure issuers and senior positions in global systemically important banks, including European Yankee banks. Spreads of higher-beta positions in US health care issuers were also top contributors. Government-related exposures were net detractors to total returns during the quarter.
| Top Contributors to Credit Return (Sector) |
|---|
Energy-Infrastructure |
Financials |
| Health Care |
Source: RPIA. Data as of 06/30/2025.
| Top Contributors to Credit Return (Issuer) |
|---|
| Morgan Stanley |
| AltaGas Ltd. |
| Foundry JV HoldCo LLC |
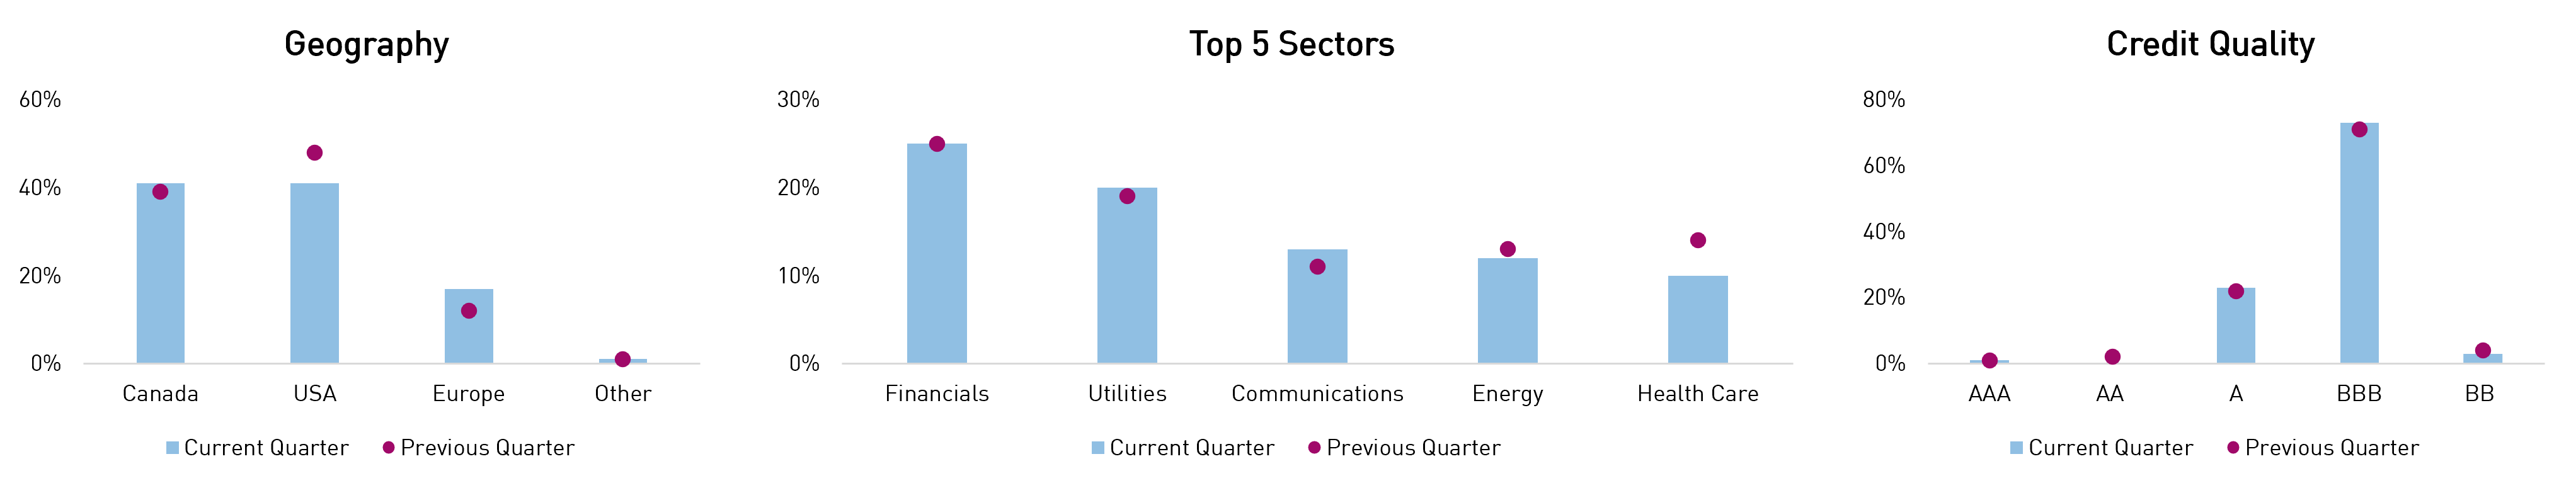
Headline risk exposures were actively managed during the period, with interest rate exposure and credit risk tactically ranging depending on valuations. Geographically, the portfolio monetized US-domiciled exposure in favour of adding to European issuers, mainly consisting of Yankee banks. Sector-wise, the portfolio trimmed well-performing health care positions and rotated into telecom/media exposures. Quality-wise, the portfolio maintained minimal (3%) high yield exposure, which primarily consists of corporate hybrid securities of issuers rated investment grade at the senior security level. We believe the Fund can continue to actively source positive returns from both interest rate and credit spread exposure, underpinned by elevated yields and an attractive technical environment for credit.
| Q2 2025 | Q1 2025 | |
|---|---|---|
| Effective Duration (Years) | 5.2 | 5.0 |
| Credit Duration (Years) | 4.4 | 5.0 |
| Average Term (Years) | 8.3 | 11.5 |
| % Rated Investment Grade | 97% | 96% |
Source: RPIA. Data as of 06/30/2025.
Source: RPIA. Data as of 06/30/2025.
RP Alternative Global Bond Fund
| 1 MON | 3 MON | 6 MON | YTD | 1 YR | 3 YR | 5 YR | Since Inception | |
|---|---|---|---|---|---|---|---|---|
| RP Alternative Global Bond Fund (Class F) | 0.71% | 1.38% | 3.54% | 3.54% | 6.99% | 8.37% | 7.61% | 6.55% |
| FTSE Canada All Corporate Bond Index | 0.29% | 0.45% | 2.28% | 2.28% | 8.15% | 6.27% | 1.69% | 2.50% |
Source: RPIA, FTSE Russell. Data as of 06/30/2025 and annualized for periods greater than one year. SI = 07/2019.
AGB returned +1.38% during the quarter, outperforming the FTSE Canada All Corporate Bond Index (the “Index”).
The Fund generated strong returns from credit spread exposures that were well-diversified across geographies. Additionally, active duration management and a preference for US interest rate exposure limited the negative impact from the selloff in Canadian interest rates. Credit returns were led by high-quality Yankee banks, including subordinated debt that outperformed their more senior counterparts. Positions in energy-infrastructure bonds, namely Enbridge commercial paper and AltaGas USD-denominated hybrids, performed notably well. The Fund’s dynamic hedges provided mixed returns overall but efficiently limited downside volatility, especially during the tariff-related selloff in April.
| Top Contributors to Credit Return (Sector) |
|---|
| Financials |
| Energy-Infrastructure |
| Health Care |
Source: RPIA. Data as of 06/30/2025.
| Top Contributors to Credit Return (Issuer) |
|---|
| Lloyds Banking Group PLC |
| HSBC Holdings PLC |
| Foundry JV HoldCo LLC |
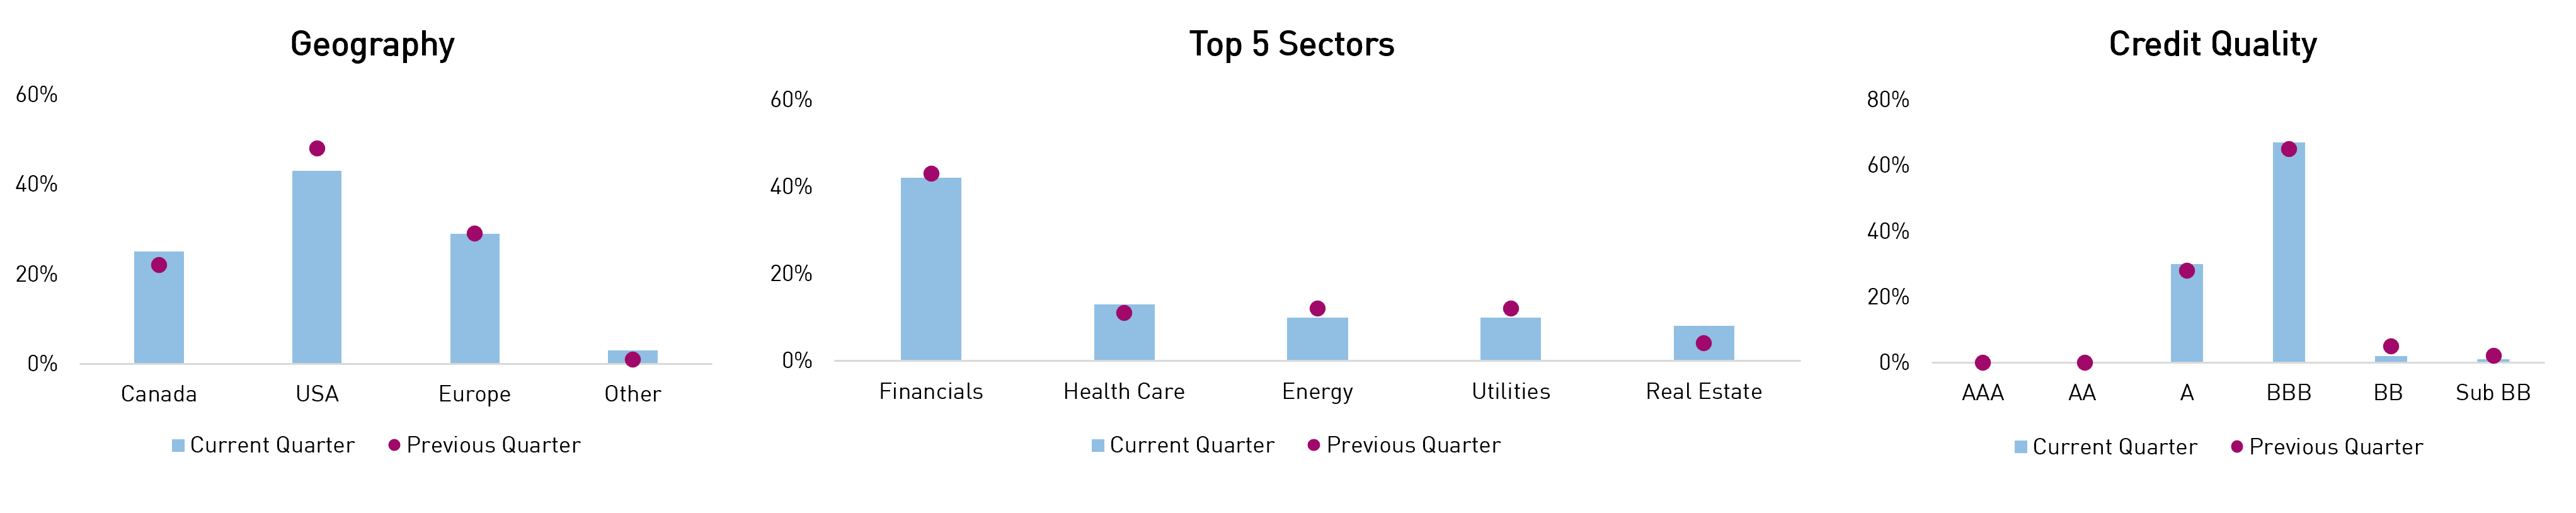
Interest rate exposure was managed actively between 0.0-4.7yrs of duration as the portfolio successfully navigated the volatile interest rate environment. Credit risk was reduced significantly at the beginning of the quarter and remained subdued thereafter. Geographically, well-performing US-domiciled and EUR-domiciled credit exposures were monetized, and capital was rotated into Canadian credit, particularly domestic systemically important banks. In addition to the increase in high-quality financials, the portfolio increased exposure to dynamic credit hedges. In terms of credit quality, the portfolio reduced its already modest high yield positions and moved up-in-quality to A rated issuers. We believe the Fund is well-positioned to continue navigating the increasingly volatile market given its expanded toolkit and commonsense approach.
| Q2 2025 | Q1 2025 | |
|---|---|---|
| Effective Duration (Years) | 0.9 | 0.9 |
| Credit Duration (Years) | 3.2 | 5.6 |
| Average Term (Years) | 6.5 | 6.9 |
| Net Credit Leverage | 0.8x | 1.1x |
| % Rated Investment Grade | 97% | 93% |
Source: RPIA. Data as of 06/30/2025.
Source: RPIA. Data as of 06/30/2025.
RP Debt Opportunities
| 1 MON | 3 MON | 6 MON | YTD | 1 YR | 3 YR | 5 YR | 10 YR | Since Inception | |
|---|---|---|---|---|---|---|---|---|---|
| RP Debt Opportunities | 0.45% | 0.91% | 1.88% | 1.88% | 4.94% | 8.01% | 7.09% | 5.66% | 7.57% |
| FTSE Canada All Corporate Bond Index | 0.29% | 0.45% | 2.28% | 2.28% | 8.15% | 6.27% | 1.69% | 3.04% | 4.04% |
Source: RPIA, FTSE Russell. Data as of 06/30/2025 and annualized for periods greater than one year. SI = 10/2009. RP Debt Opportunities strategy performance presented above represents a composite return of RP Debt Opportunities Fund LP Class A and RP Debt Opportunities Fund Ltd. Class A, from October 2009 to July 2011 and RP Debt Opportunities Fund Ltd. Class A. from August 2011 onwards.
DOF returned +0.91% during the quarter, outperforming the FTSE Canada All Corporate Bond Index (the “Index”).
The Strategy generated strong returns from credit spread exposures while active duration management and a preference for US interest rate exposure limited the negative impact from the selloff in Canadian interest rates. Credit returns were led by high-quality Yankee banks, including subordinated debt that outperformed their more senior counterparts. Positions in energy-infrastructure issuers across geographies also performed notably well. Other contributions to credit returns were driven by positions in US-domiciled health care issuers and select real estate positions. The Strategy’s dynamic hedges provided mixed returns overall but efficiently limited downside volatility, especially during the tariff-related selloff in April.
| Top Contributors to Credit Return (Sector) |
|---|
| Financials |
| Energy-Infrastructure |
| Health Care |
Source: RPIA. Data as of 06/30/2025.
| Top Contributors to Credit Return (Issuer) |
|---|
| Lloyds Banking Group PLC |
| HSBC Holdings PLC |
| Foundry JV HoldCo LLC |
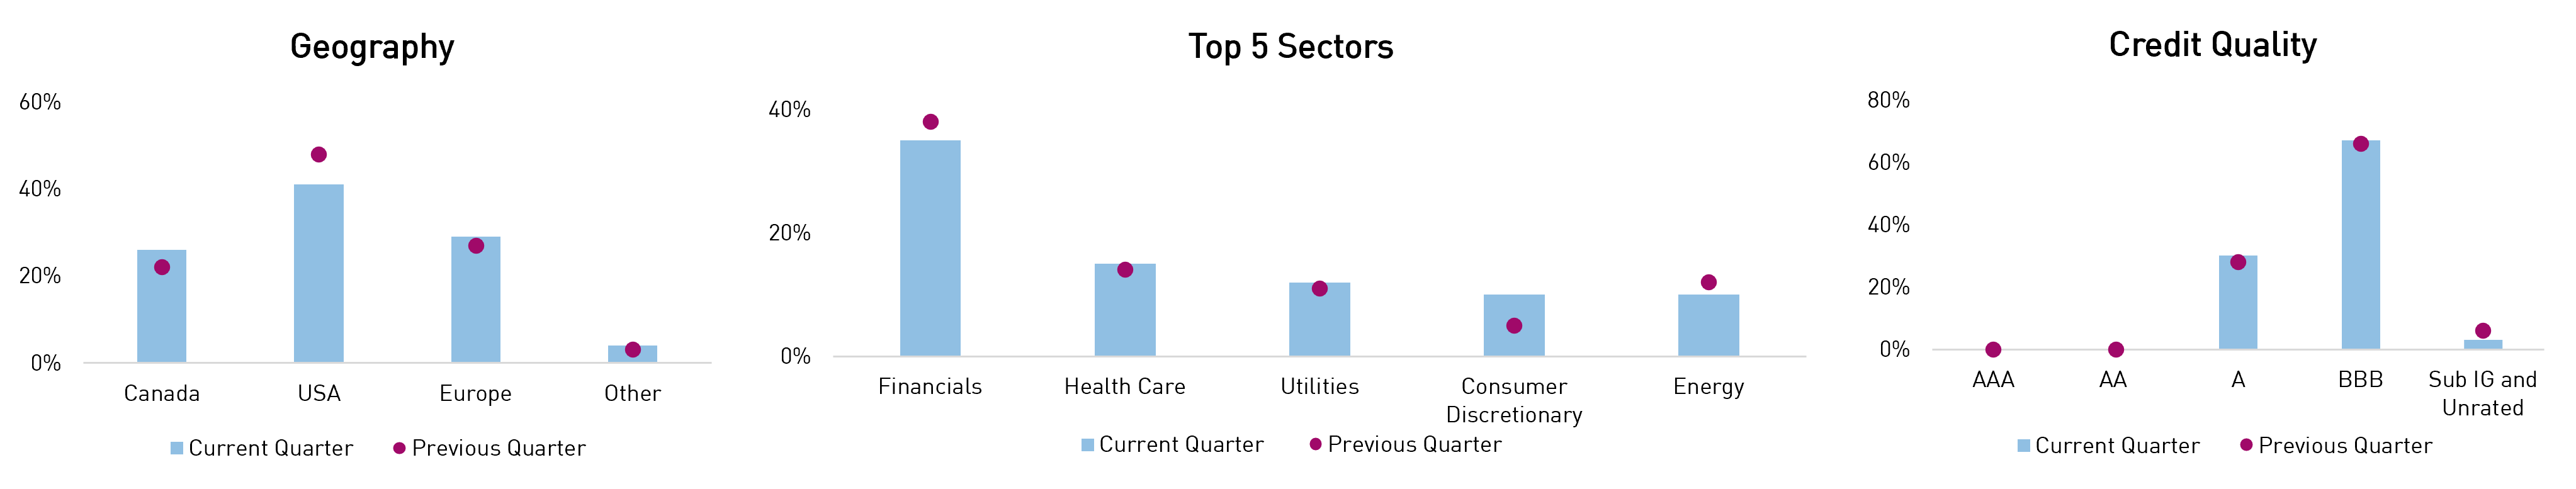
The portfolio carried a higher-than-average exposure to interest rates before reducing duration into quarter-end, while credit risk was reduced significantly at the beginning of the quarter and remained subdued thereafter. Geographically, well-performing US-domiciled credit exposures were monetized, and capital was rotated into Canadian credit, particularly domestic systemically important banks. In addition to the increase in high-quality financials, the portfolio monetized well-performing subordinated bank debt and increased exposure to dynamic credit hedges. In terms of credit quality, the portfolio reduced its already modest high yield positions and moved up-in-quality to A rated issuers. We believe the Strategy is well-positioned to continue to navigate ever-changing markets and generate strong risk-adjusted returns, given its expanded toolkit and commonsense approach.
| Q2 2025 | Q1 2025 | |
|---|---|---|
| Effective Duration (Years) | 0.7 | 0.7 |
| Credit Duration (Years) | 3.2 | 5.8 |
| Average Term (Years) | 6.8 | 7.0 |
| Net Credit Leverage | 0.8x | 1.2x |
| % Rated Investment Grade | 97% | 94% |
Source: RPIA. Data as of 06/30/2025.
Source: RPIA. Data as of 06/30/2025.
RP Select Opportunities
| 1 MON | 3 MON | 6 MON | YTD | 1 YR | 3 YR | 5 YR | 10 YR | Since Inception | |
|---|---|---|---|---|---|---|---|---|---|
| RP Select Opportunities Strategy | 0.98% | 0.33% | 0.14% | 0.14% | 4.39% | 10.69% | 12.73% | 8.29% | 8.00% |
| Bloomberg US High Yield (CAD Hedged) | 1.68% | 3.07% | 3.74% | 3.74% | 8.75% | 8.85% | 5.21% | 4.57% | 4.30% |
Source: RPIA, Bloomberg. Data as of 06/30/2025 and annualized for periods greater than one year. SI = 04/2014. RP Select Opportunities strategy performance presented above is a hypothetical illustration based on the weighted average composite return of a separately managed account utilizing a similar strategy from inception in April 2014 to May 2014, then linked to the returns of RP Select Opportunities Cayman Fund Ltd. – Class C Lead.
SOF returned +0.33% during the quarter, underperforming the Bloomberg US High Yield (CAD Hedged) Bond Index (the “Index”).
The Strategy generated positive total returns during the quarter after a strong recovery following the broad selloff in April. Credit returns were primarily driven by financial-related exposures, which were split between specialty financials, diversified banks, insurance companies, and select consumer finance issuers. Other contributors were well-diversified between real estate, energy, industrials, and health care issuers. The Strategy’s dynamic hedges provided mixed returns overall but efficiently limited downside volatility.
| Top Contributors to Credit Return (Sector) |
|---|
| Financials |
| Real Estate |
| Energy-Infrastructure |
Source: RPIA. Data as of 06/30/2025.
| Top Contributors to Credit Return (Issuer) |
|---|
| SDPR S&P 500 ETF Trust |
| SBL Holdings Inc. |
| Jefferson Capital Holdings LLC |
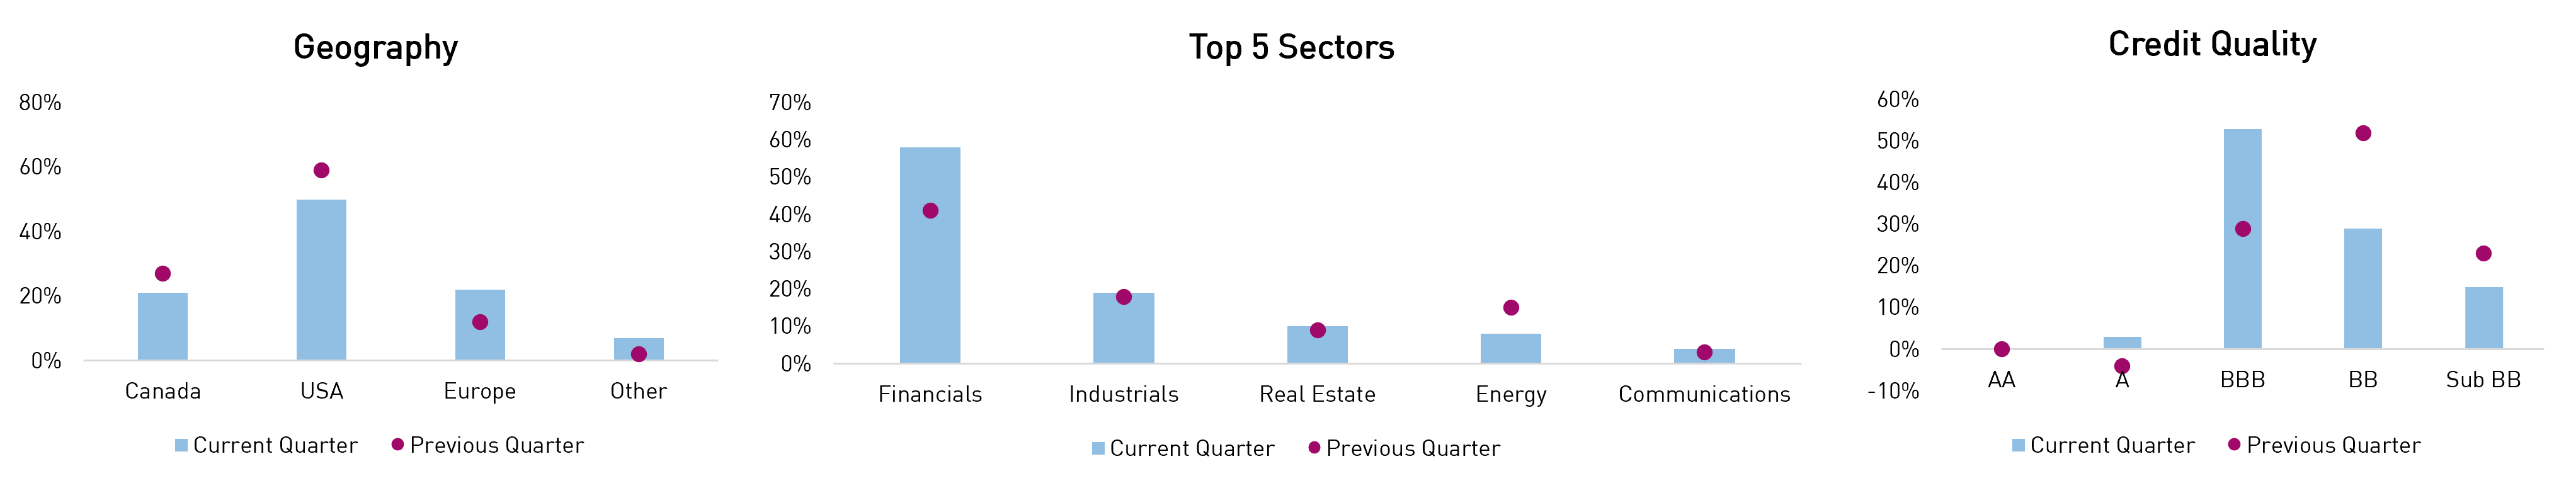
Credit risk was reduced significantly at the beginning of the quarter and remained subdued thereafter as risk assets rallied. Geographically, the portfolio monetized well-performing domestic and US-domiciled credit risk and rotated into international exposures. Sector-wise, more cyclical exposures were reduced, and exposure to financials and dynamic credit hedges was markedly increased. The portfolio significantly upgraded in terms of credit quality, monetizing high yield exposures and rotating heavily into higher-quality investment grade bonds. We believe the portfolio’s more conservative stance sets us up to take advantage of compelling opportunities as they emerge. In the meantime, we aim to continue providing investors with an effective alternative to traditional fixed income, equity, and private asset allocations.
| Q2 2025 | Q1 2025 | |
|---|---|---|
| Effective Duration (Years) | 3.0 | 3.5 |
| Credit Duration (Years) | 2.6 | 3.6 |
| Average Term (Years) | 4.8 | 4.7 |
| Net Credit Leverage | 1.0x | 1.2x |
| % Rated Investment Grade | 56% | 25% |
Source: RPIA. Data as of 06/30/2025.
Source: RPIA. Data as of 06/30/2025.
RP Fixed Income Plus
| 1 MON | 3 MON | 6 MON | YTD | 1 YR | 3 YR | 5 YR | 10 YR | Since Inception | |
|---|---|---|---|---|---|---|---|---|---|
| RP Fixed Income Plus | 0.58% | 1.09% | 2.60% | 2.60% | 6.34% | 4.90% | 2.75% | 2.63% | 3.65% |
| FTSE Canada Universe Short-Term Bond Index | 0.27% | 0.49% | 2.19% | 2.19% | 6.34% | 4.42% | 1.76% | 1.94% | 2.31% |
| Added Value | 0.31% | 0.60% | 0.41% | 0.41% | 0.00% | 0.48% | 0.99% | 0.69% | 1.34% |
Source: RPIA. FTSE Russell. Data as of 06/30/2025 and annualized for periods greater than one year. SI = 07/2010. RP Fixed Income Plus strategy performance presented above represents a weighted-average composite return of separately managed accounts utilizing a similar strategy from inception in July 2010 to April 2013 and linked to the returns of the RP Fixed Income Plus Fund, Series A thereafter.
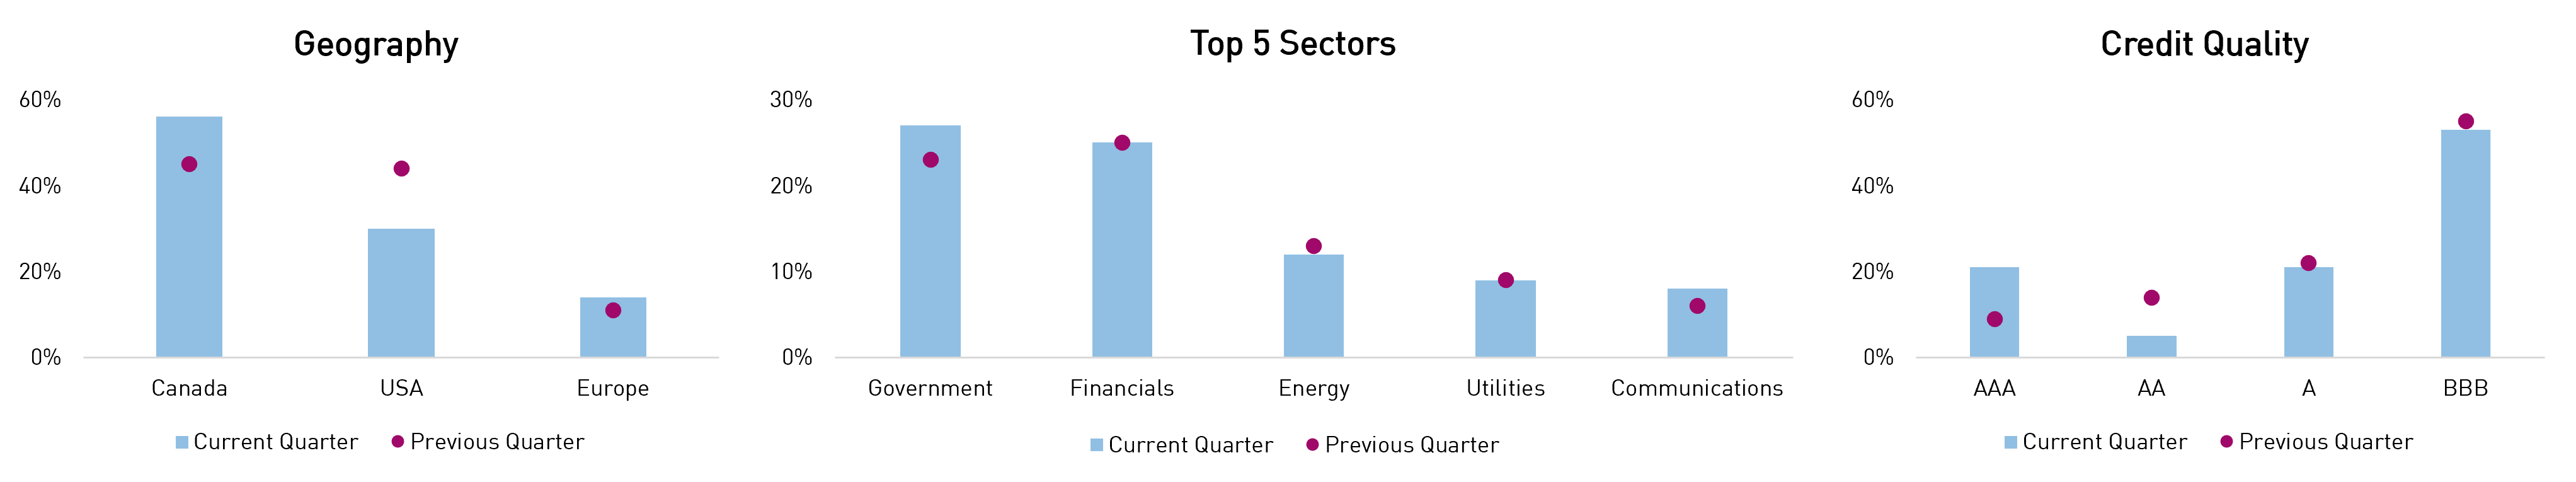
FIP returned +1.09% during the quarter, outperforming the FTSE Canada Universe Short-Term Bond Index (the “Index”).
The Strategy generated positive returns from interest rates and credit spreads, and both exposures contributed to relative outperformance versus the Index. Credit returns were driven by high-quality global systemically important banks, specifically European banks. Positions in domestic energy-infrastructure issuers and South Bow bonds (TransCanada spinoff) provided alpha during the period. Higher-beta health care and telecom/media exposures also provided strong returns alongside the rally in credit spreads more broadly.
| Top Contributors to Credit Return (Sector) |
|---|
| Financials |
| Energy-Infrastructure |
| Health Care |
Source: RPIA. Data as of 06/30/2025.
| Top Contributors to Credit Return (Issuer) |
|---|
BNP Paribas SA |
| Charter Communications Inc. |
| Inter Pipeline Ltd |
Headline portfolio metrics were relatively unchanged quarter-over-quarter. From a geographic perspective, the portfolio monetized US-domiciled exposures and rotated mainly into domestic opportunities. Sector-wise, Canadian government-related exposures were increased, while well-performing cyclical exposures were trimmed. The portfolio’s AAA-rated exposures increased alongside the increase in Canadian government bonds. We believe the Strategy continues to offer investors a high-quality value proposition, given its 27% government bond exposure and healthy yield of 3.9%, more than +90bps greater than the Index’s yield.
| Q2 2025 | Q1 2025 | |
|---|---|---|
| Effective Duration (Years) | 2.7 | 2.5 |
| Credit Duration (Years) | 2.1 | 2.1 |
| Average Term (Years) | 3.0 | 2.8 |
| % Rated Investment Grade | 100% | 100% |
Source: RPIA. Data as of 06/30/2025.
Source: RPIA. Data as of 06/30/2025.