
Our Latest Market Updates
The Shape of a Soft Landing - Q3 2025 Notes from the Trading Desk
Credit Market Themes in 5 Charts - Q3 2025
RP Strategic Income Plus Fund
| 1 MON | 3 MON | 6 MON | YTD | 1 YR | 3 YR | 5 YR | Since Inception | |
|---|---|---|---|---|---|---|---|---|
| RP Strategic Income Plus Fund (Class F) | 1.39% | 1.91% | 2.50% | 4.28% | 4.05% | 5.98% | 3.39% | 3.90% |
| FTSE Canada All Corporate Bond Index | 1.62% | 1.81% | 2.27% | 4.13% | 5.20% | 6.83% | 1.79% | 3.20% |
Source: RPIA, FTSE Russell. Data as of 09/30/2025 and annualized for periods greater than one year. SI = 04/2016.
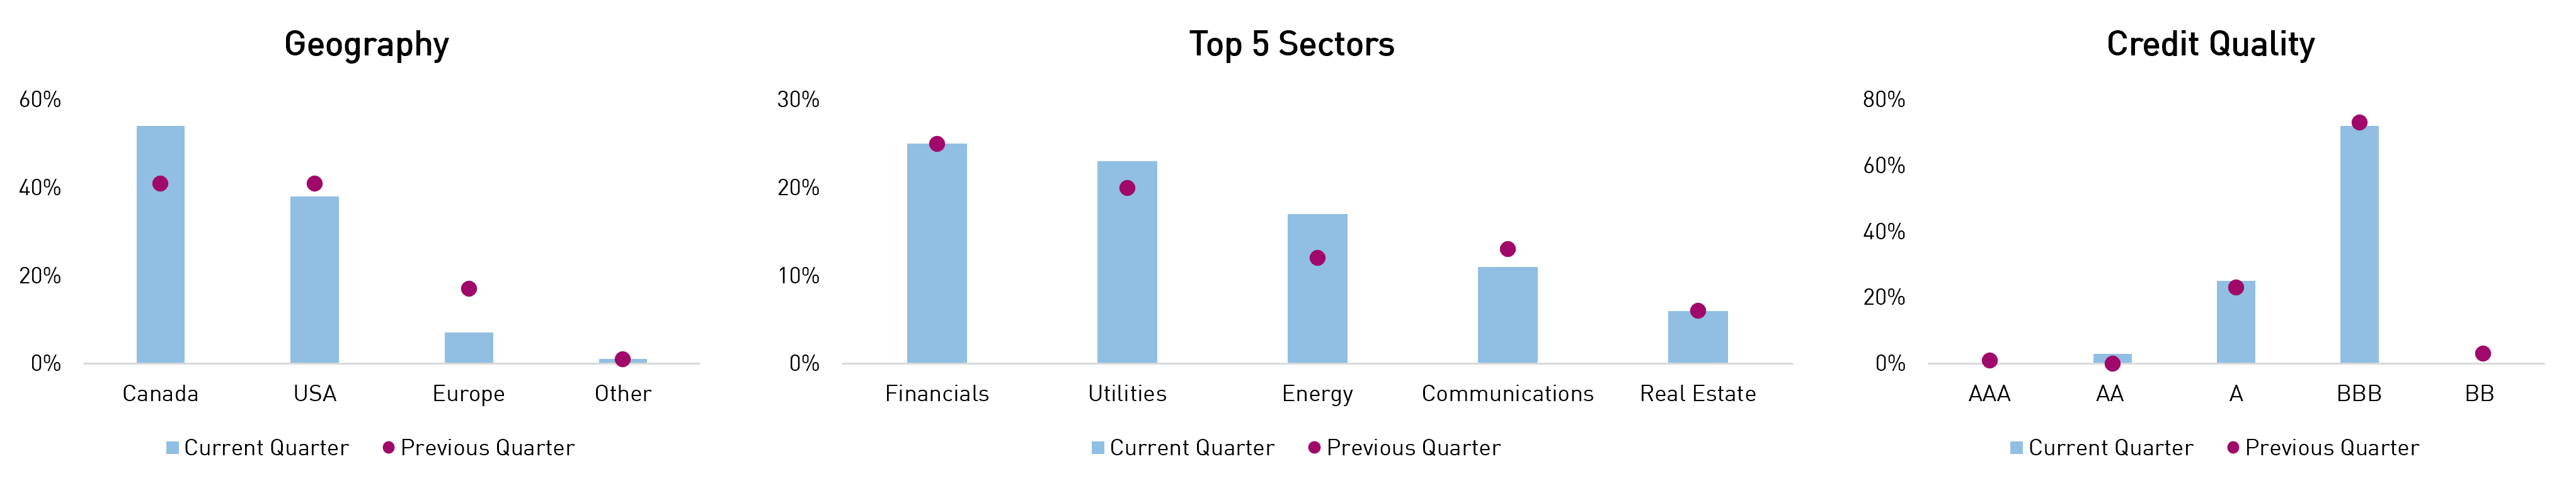
STIP gained +1.91% during the quarter, outperforming the FTSE Canada All Corporate Bond Index (the “Index”).
The Fund generated positive returns from interest rate and credit spread exposures, with both driving relative outperformance versus the Index during the period. Given the relative underperformance of domestic credit spreads, the portfolio’s US and European credit exposure was a source of alpha. Credit returns were driven by spread compression in domestic and French energy infrastructure issuers and senior positions in global systemically important banks, including European Yankee banks. Spreads of TMT-related exposures, including Canadian telecoms and US technology issuers like Foundry JV Holdco, tightened notably during the quarter. Government-related exposures were net contributors to total returns as interest rates rallied.
| Top Contributors to Credit Return (Sector) |
|---|
Energy-Infrastructure |
Financials |
| Technology/Media/Telecom |
Source: RPIA. Data as of 09/30/2025.
| Top Contributors to Credit Return (Issuer) |
|---|
| Foundry JV HoldCo LLC |
| AltaGas Ltd. |
| Enbridge Inc. |
Headline risk exposures were actively managed during the period, with interest rate exposure and credit risk tactically ranging depending on valuations. Overall, interest rate duration remains higher while credit exposure remains muted relative to long-run averages. Geographically, the portfolio monetized European-domiciled exposure in favour of adding to domestic credit, especially near quarter-end when Canadian new issue supply picked up. Sector-wise, the portfolio trimmed well-performing health care positions and rotated into attractively priced utility and energy infrastructure new issues. Quality-wise, the portfolio is 100% investment grade after monetizing its minimal high yield exposure. We believe the Fund can continue to actively source positive returns from both interest rate and credit spread exposure, underpinned by elevated yields and an attractive technical environment for credit.
| Q3 2025 | Q2 2025 | |
|---|---|---|
| Effective Duration (Years) | 5.6 | 5.2 |
| Credit Duration (Years) | 4.1 | 4.4 |
| Average Term (Years) | 8.8 | 8.3 |
| % Rated Investment Grade | 100% | 97% |
Source: RPIA. Data as of 09/30/2025.
Source: RPIA. Data as of 09/30/2025.
RP Alternative Global Bond Fund
| 1 MON | 3 MON | 6 MON | YTD | 1 YR | 3 YR | 5 YR | Since Inception | |
|---|---|---|---|---|---|---|---|---|
| RP Alternative Global Bond Fund (Class F) | 0.91% | 2.40% | 3.82% | 6.03% | 6.99% | 8.88% | 7.27% | 6.69% |
| FTSE Canada All Corporate Bond Index | 1.62% | 1.81% | 2.27% | 4.13% | 5.20% | 6.83% | 1.79% | 2.70% |
Source: RPIA, FTSE Russell. Data as of 09/30/2025 and annualized for periods greater than one year. SI = 07/2019.
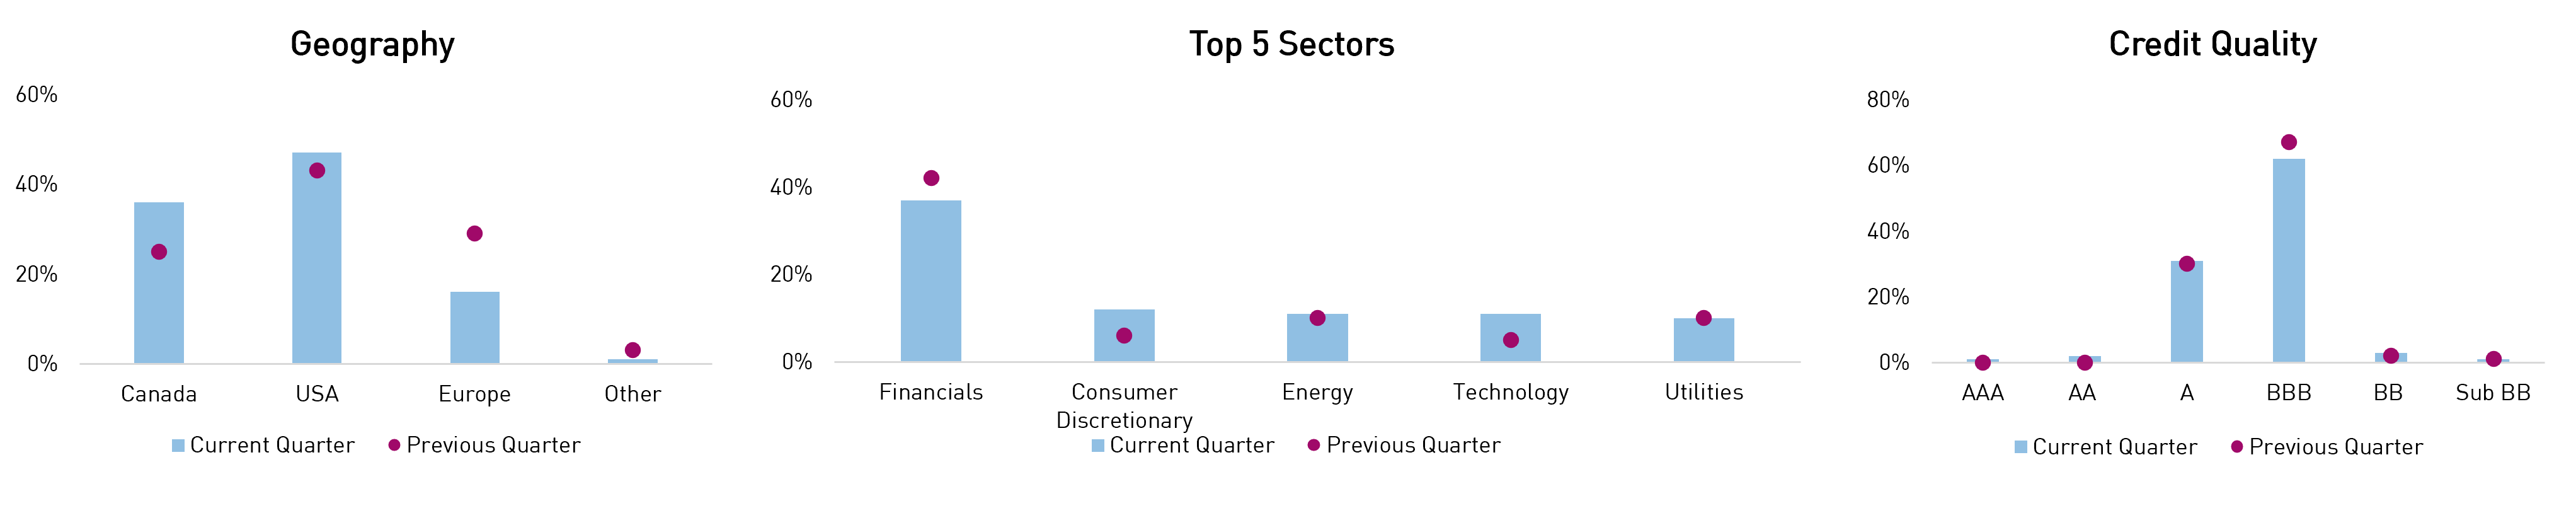
AGB returned +2.40% during the quarter, outperforming the FTSE Canada All Corporate Bond Index (the “Index”).
The Fund generated strong returns from credit spread and interest rate exposures, with both exposures contributing to relative outperformance versus the Index. High-quality European banks led credit returns through both Euro- and USD-denominated bonds. Positions in energy infrastructure bonds, namely Enbridge commercial paper and a Reverse Yankee position in Euro-denominated Duke Energy bonds, performed notably well. Other contributions were led by hybrid positions in domestic telecom issuers, AI-related debt of large technology companies, and notable credit spread tightening in Ford bonds. The Fund’s dynamic hedges were net detractors as risk premia rallied during the period.
| Top Contributors to Credit Return (Sector) |
|---|
| Energy-Infrastructure |
| Financials |
| Technology/Media/Telecom |
Source: RPIA. Data as of 09/30/2025.
| Top Contributors to Credit Return (Issuer) |
|---|
| Foundry JV HoldCo LLC |
| Ford Credit Canada Co/Canada |
| Enbridge Inc. |
Interest rate exposure was managed actively between 0.9-6.1yrs of duration while credit risk remained muted relative to the portfolio’s long-run average. Geographically, well-performing non-North American credit was monetized and rotated into domestic credit, particularly Canadian new issues near quarter-end. Sector-wise, US health care exposures were trimmed and rotated into newly issued Oracle (technology) and Ford (consumer discretionary) bonds. In terms of credit quality, the portfolio remains up-in-quality with only ~4% high yield credit and embedded downside protection through credit hedges. We believe the Fund is well-positioned to continue navigating the increasingly volatile market given its expanded toolkit and commonsense approach.
| Q3 2025 | Q2 2025 | |
|---|---|---|
| Effective Duration (Years) | 3.1 | 0.9 |
| Credit Duration (Years) | 1.8 | 3.2 |
| Average Term (Years) | 12.2 | 6.5 |
| Net Credit Leverage | 0.4x | 0.8x |
| % Rated Investment Grade | 96% | 97% |
Source: RPIA. Data as of 09/30/2025.
Source: RPIA. Data as of 09/30/2025.
RP Debt Opportunities
| 1 MON | 3 MON | 6 MON | YTD | 1 YR | 3 YR | 5 YR | 10 YR | 15 YR | Since Inception | |
|---|---|---|---|---|---|---|---|---|---|---|
| RP Debt Opportunities | 0.72% | 1.73% | 2.66% | 3.65% | 5.10% | 7.80% | 6.45% | 5.88% | 6.48% | 7.56% |
| FTSE Canada All Corporate Bond Index | 1.62% | 1.81% | 2.27% | 4.13% | 5.20% | 6.83% | 1.79% | 3.24% | 3.78% | 4.09% |
Source: RPIA, FTSE Russell. Data as of 09/30/2025 and annualized for periods greater than one year. SI = 10/2009. RP Debt Opportunities strategy performance presented above represents a composite return of RP Debt Opportunities Fund LP Class A and RP Debt Opportunities Fund Ltd. Class A, from October 2009 to July 2011 and RP Debt Opportunities Fund Ltd. Class A. from August 2011 onwards.
DOF returned +1.73% during the quarter, modestly underperforming the FTSE Canada All Corporate Bond Index (the “Index”).
The Strategy generated strong returns from credit spread exposures, and a tactical increase in interest rate exposure also performed well. High-quality European banks led credit returns through both Euro- and USD-denominated bonds. Positions in energy infrastructure bonds, namely Enbridge commercial paper and a Reverse Yankee position in Euro-denominated Duke Energy bonds, performed notably well. Other contributions were led by select real estate issuers, AI-related debt of large technology companies, and notable credit spread tightening in Ford bonds. The Strategy’s dynamic hedges were net detractors as risk premia rallied during the period.
| Top Contributors to Credit Return (Sector) |
|---|
| Financials |
| Energy-Infrastructure |
| Real Estate |
Source: RPIA. Data as of 09/30/2025.
| Top Contributors to Credit Return (Issuer) |
|---|
| Foundry JV HoldCo LLC |
| Ford Credit Canada Co/Canada |
| Lloyds Banking Group PLC |
The portfolio carried a higher-than-average exposure to interest rates before reducing duration into quarter-end, while credit risk remained subdued. Geographically, well-performing EUR-domiciled credit exposures were monetized, and capital was rotated into North American credit, particularly in new issue opportunities. Sector-wise, US health care exposures were trimmed and rotated into newly issued Oracle (technology) and Ford (consumer discretionary) bonds, while dynamic credit hedges were also increased. In terms of credit quality, the portfolio trimmed outperforming BBB-rated exposures in favour of moving up in quality to A and above rated securities. We believe the Strategy is well-positioned to continue to navigate ever-changing markets and generate strong risk-adjusted returns as we wait for more attractive entry points to increase credit exposure.
| Q3 2025 | Q2 2025 | |
|---|---|---|
| Effective Duration (Years) | 2.2 | 0.7 |
| Credit Duration (Years) | 1.8 | 3.2 |
| Average Term (Years) | 12.7 | 6.8 |
| Net Credit Leverage | 0.4x | 0.8x |
| % Rated Investment Grade | 96% | 97% |
Source: RPIA. Data as of 09/30/2025.

Source: RPIA. Data as of 09/30/2025.
RP Select Opportunities
| 1 MON | 3 MON | 6 MON | YTD | 1 YR | 3 YR | 5 YR | 10 YR | Since Inception | |
|---|---|---|---|---|---|---|---|---|---|
| RP Select Opportunities Strategy | 1.42% | 3.73% | 4.07% | 3.88% | 5.10% | 11.24% | 11.02% | 8.75% | 8.16% |
| Bloomberg US High Yield (CAD Hedged) | 0.68% | 2.08% | 5.22% | 5.90% | 5.71% | 9.94% | 4.73% | 5.31% | 4.39% |
Source: RPIA, Bloomberg. Data as of 09/30/2025 and annualized for periods greater than one year. SI = 04/2014. RP Select Opportunities strategy performance presented above is a hypothetical illustration based on the weighted average composite return of a separately managed account utilizing a similar strategy from inception in April 2014 to May 2014, then linked to the returns of RP Select Opportunities Cayman Fund Ltd. – Class C Lead.
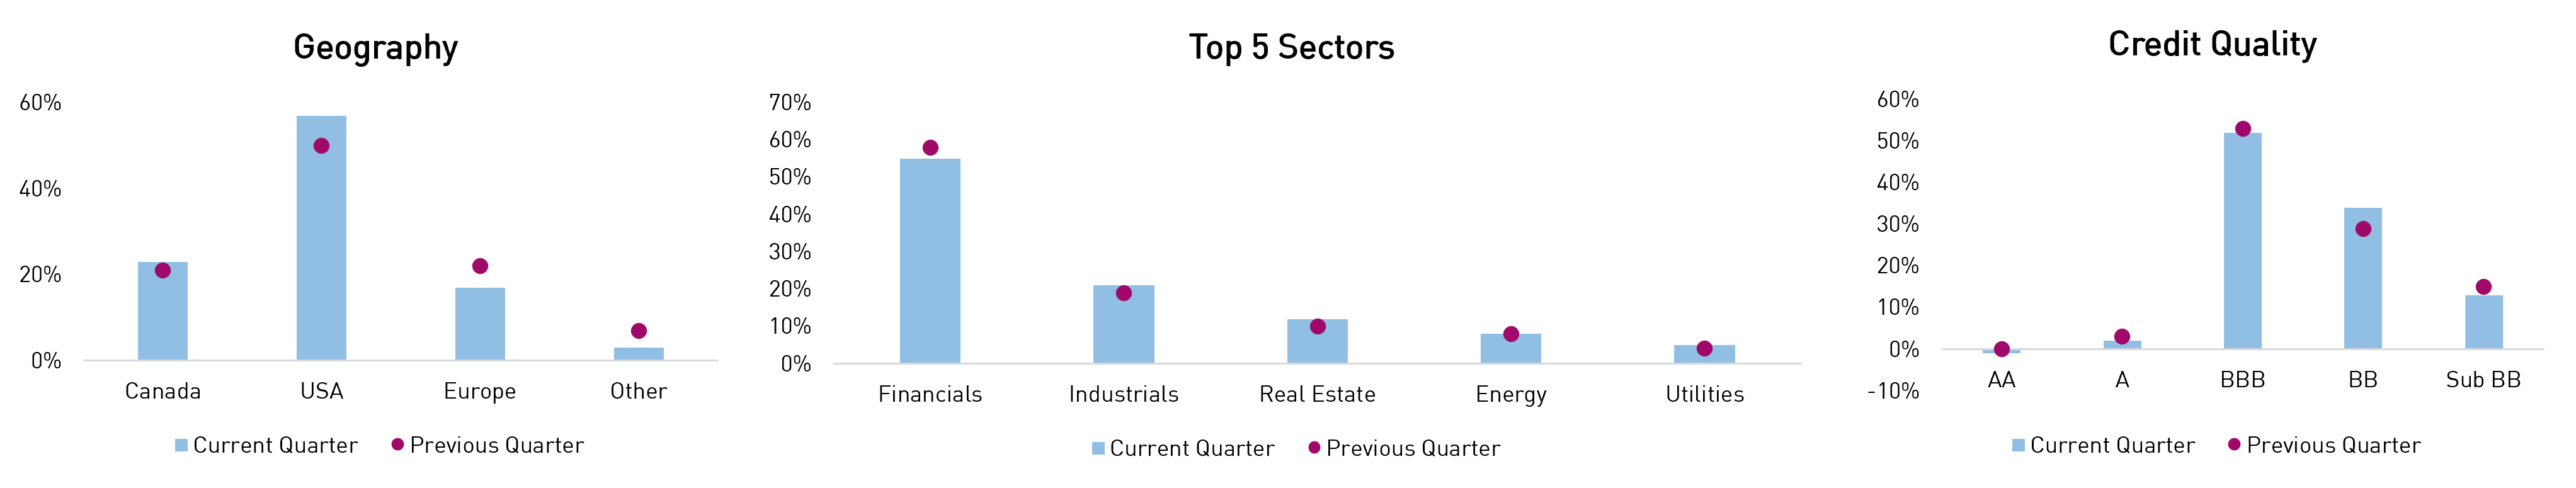
SOF returned +3.73% during the quarter, outperforming the Bloomberg US High Yield (CAD Hedged) Bond Index (the “Index”).
The Strategy generated outsized returns on an absolute and relative basis as credit spreads continued to recover from the minor hiccup around Liberation Day. Credit returns were primarily driven by financial-related exposures, which were split between specialty financials, diversified banks, insurance companies, and select consumer finance issuers. Other contributors were well-diversified between airlines, fundamental positions in real estate issuers, and several high-conviction trades in issuers with unique catalysts and lower reliance on broad market moves. The Strategy’s dynamic hedges were net detractors as risk premia rallied during the period.
| Top Contributors to Credit Return (Sector) |
|---|
| Financials |
| Consumers |
| Energy-Infrastructure |
Source: RPIA. Data as of 09/30/2025.
| Top Contributors to Credit Return (Issuer) |
|---|
| SBL Holdings Inc. |
| Domtar Corp. |
| Avianca Midco 2 PLC |
Credit risk remained subdued during the quarter, opting to isolate unique opportunities rather than embed broad market exposure at expensive valuations. Geographically, the portfolio monetized well-performing international credit in favour of rotating into North American opportunities, particularly within the US market. Sector-wise, there were no material changes on the long side of the portfolio, but we continue to populate the portfolio with single-name shorts on cyclical issuers with negative catalysts. The portfolio remains >50% investment grade, and high yield exposure is fully concentrated on the BB and B rated bonds, continuing to opt against diving into lower quality segments of the market. We believe the portfolio’s more conservative stance sets us up to take advantage of compelling opportunities as they emerge. In the meantime, we aim to continue providing investors with an effective alternative to traditional fixed income, equity, and private asset allocations.
| Q3 2025 | Q2 2025 | |
|---|---|---|
| Effective Duration (Years) | 3.1 | 3.0 |
| Credit Duration (Years) | 1.8 | 2.6 |
| Average Term (Years) | 4.5 | 4.8 |
| Net Credit Leverage | 0.9x | 1.0x |
| % Rated Investment Grade | 53% | 56% |
Source: RPIA. Data as of 09/30/2025.
Source: RPIA. Data as of 09/30/2025.
RP Fixed Income Plus
| 1 MON | 3 MON | 6 MON | YTD | 1 YR | 3 YR | 5 YR | 10 YR | Since Inception | |
|---|---|---|---|---|---|---|---|---|---|
| RP Fixed Income Plus | 0.69% | 1.41% | 2.51% | 4.04% | 4.37% | 5.40% | 2.86% | 2.77% | 3.68% |
| FTSE Canada Universe Short-Term Bond Index | 0.83% | 1.32% | 1.81% | 3.54% | 4.21% | 4.98% | 1.88% | 2.07% | 2.36% |
| Added Value | -0.14% | 0.09% | 0.70% | 0.50% | 0.16% | 0.42% | 0.98% | 0.70% | 1.32% |
Source: RPIA. FTSE Russell. Data as of 09/30/2025 and annualized for periods greater than one year. SI = 07/2010. RP Fixed Income Plus strategy performance presented above represents a weighted-average composite return of separately managed accounts utilizing a similar strategy from inception in July 2010 to April 2013 and linked to the returns of the RP Fixed Income Plus Fund, Series A thereafter.
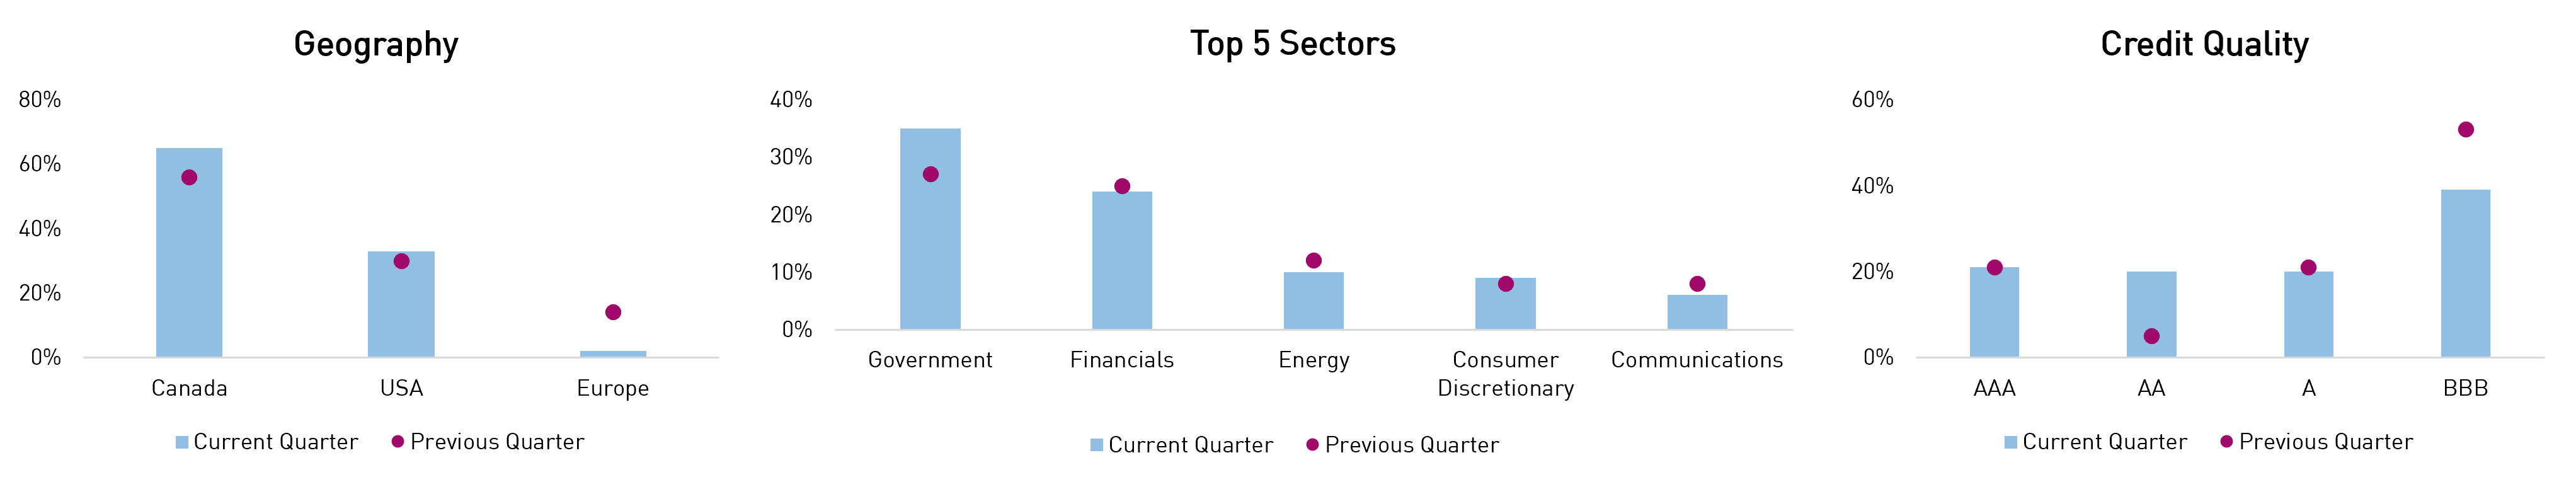
FIP returned +1.41% during the quarter, outperforming the FTSE Canada Universe Short-Term Bond Index (the “Index”).
The Strategy generated positive returns from interest rates and credit spreads, and both exposures contributed to relative outperformance versus the Index. Credit returns were driven by high-quality Yankee banks and long-held positions in Athene Global Funding (life insurance). Positions in domestic energy infrastructure issues and South Bow bonds (TransCanada spinoff) provided strong returns during the period. Short-dated Ford bonds were the top contributors, including a CAD-denominated new issue for which the credit spread rallied more than 25 basis points.
| Top Contributors to Credit Return (Sector) |
|---|
| Financials |
| Energy-Infrastructure |
| Auto |
Source: RPIA. Data as of 09/30/2025.
| Top Contributors to Credit Return (Issuer) |
|---|
Ford Credit Canada Co/Canada |
| Athene Global Funding |
| Santander UK Group Holdings PLC |
Headline portfolio metrics were relatively unchanged quarter-over-quarter. From a geographic perspective, the portfolio monetized non-North American credit and rotated mainly into domestic opportunities, particularly through new issues. Sector-wise, government-related exposures were increased, while well-performing non-financial credit exposures were trimmed. The portfolio’s BBB-rated exposures were notably reduced in favour of AA-rated exposures. We believe the Strategy continues to offer investors a high-quality value proposition, given its 35% government bond exposure and healthy yield of 3.6%, more than +75bps greater than the Index’s yield.
| Q3 2025 | Q2 2025 | |
|---|---|---|
| Effective Duration (Years) | 3.0 | 2.7 |
| Credit Duration (Years) | 2.1 | 2.1 |
| Average Term (Years) | 3.3 | 3.0 |
| % Rated Investment Grade | 100% | 100% |
Source: RPIA. Data as of 09/30/2025.
Source: RPIA. Data as of 09/30/2025.