
Our Latest Market Updates
Policy Odyssey - Q4 2024 Notes from the Trading Desk
Credit Market Themes in 5 Charts - Q4 2024
RP Fixed Income Plus
| 1 MON | 3 MON | 6 MON | YTD | 1 YR | 3 YR | 5 YR | 10 YR | Since Inception | |
|---|---|---|---|---|---|---|---|---|---|
| RP Fixed Income Plus | 0.18% | 0.31% | 3.64% | 5.11% | 5.11% | 3.37% | 2.49% | 2.47% | 3.59% |
| FTSE Canada Universe Short-Term Bond Index | 0.38% | 0.65% | 4.06% | 5.70% | 5.70% | 2.13% | 2.13% | 1.93% | 2.23% |
| Added Value | -0.20% | -0.34% | -0.42% | -0.58% | -0.58% | 1.24% | 0.36% | 0.54% | 1.36% |
Source: RPIA. FTSE Russell. Data as of 12/31/2024 and annualized for periods greater than one year. SI = 07/2010. RP Fixed Income Plus strategy performance presented above represents a weighted-average composite return of separately managed accounts utilizing a similar strategy from inception in July 2010 to April 2013 and linked to the returns of the RP Fixed Income Plus Fund, Series A thereafter.
FIP returned +0.31% during the quarter, underperforming the FTSE Canada Universe Short-Term Bond Index (the “Index”).
The Strategy saw positive returns from credit spread exposure, while negative returns from US interest rate exposure led to underperformance relative to the Index. Returns from short-term commercial paper were muted, while agency and provincial exposures were solid contributors. Credit returns were driven by TMT-related issuers, including Charter, Rogers, and Warner Bros Discovery. Energy-infrastructure issuers were also strong contributors, led by notable credit spread compression in South Bow, which spun-off from TC Energy early in the quarter, and AltaGas, which executed a tender offer in November.
| Top Contributors to Credit Return (Sector) |
|---|
| Telecom/Media |
| Energy-Infrastructure |
| Financials |
Source: RPIA. Data as of 12/31/2024.
| Top Contributors to Credit Return (Issuer) |
|---|
| Charter Communications Inc. |
| Rogers Communications Inc. |
| Boeing Co/The |
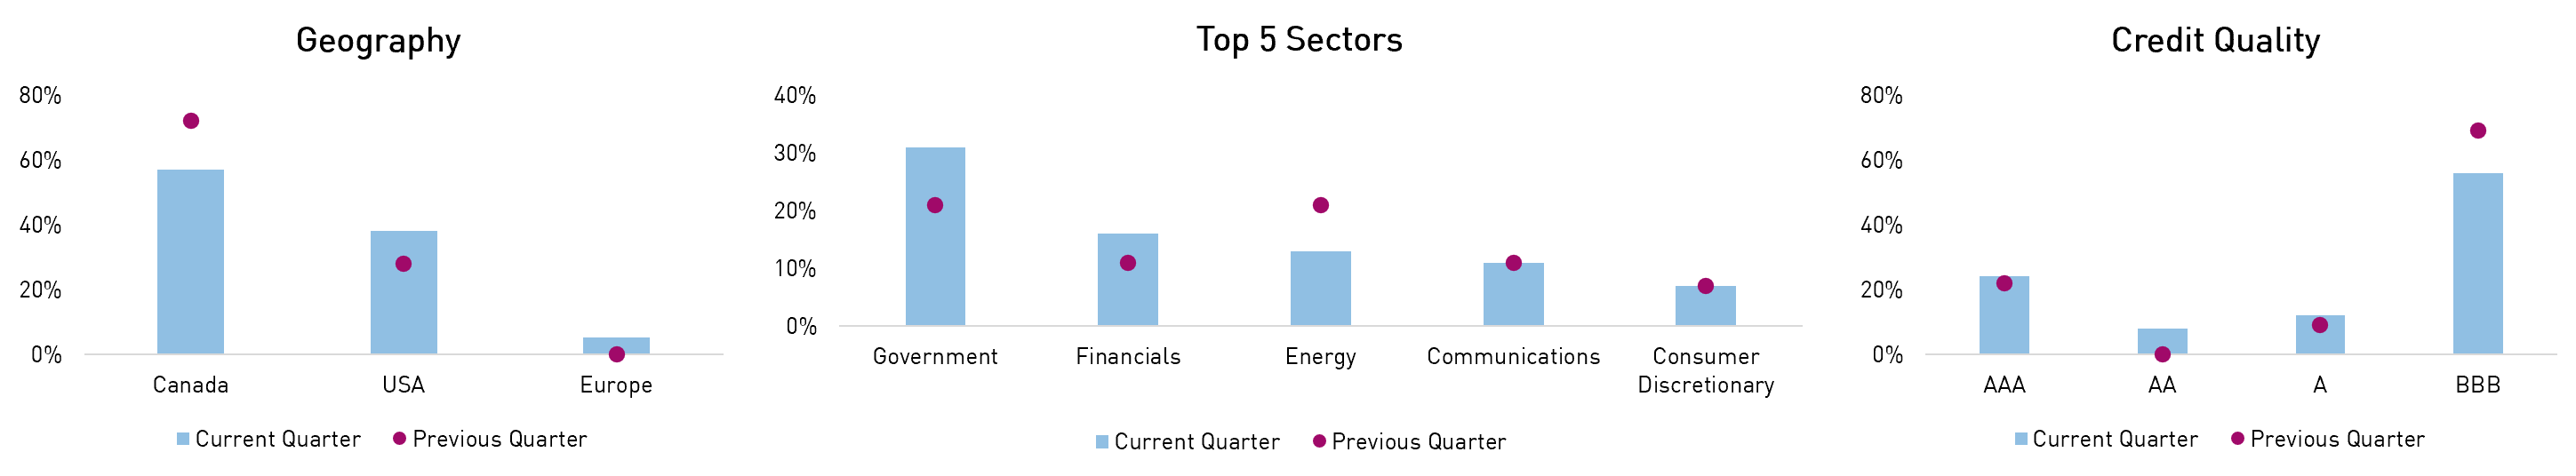
Headline portfolio metrics were relatively unchanged quarter-over-quarter, although interest rate exposure increased to ~3.0yrs in October before being reduced into year-end. From a geographic perspective, the portfolio monetized domestic exposure as Canadian spreads outperformed, rotating into more attractive US opportunities. Sector-wise, profitable consumer-related holdings were monetized and reallocated to the energy and technology sectors. The portfolio moved up-in-quality slightly by trimming BBB-rated credit exposure as spreads rallied. We believe the Strategy continues to offer investors a high-quality value proposition, given its +30% government bond exposure and healthy yield of 4.2% – 100bps greater than the Index’s yield.
| Q4 2024 | Q3 2024 | |
|---|---|---|
| Effective Duration (Years) | 2.7 | 2.5 |
| Credit Duration (Years) | 1.9 | 1.9 |
| Average Term (Years) | 3.0 | 2.8 |
| % Rated Investment Grade | 100% | 100% |
Source: RPIA. Data as of 12/31/2024.
Source: RPIA. Data as of 12/31/2024.
RP Strategic Income Plus Fund
| 1 MON | 3 MON | 6 MON | YTD | 1 YR | 3 YR | 5 YR | Since Inception | |
|---|---|---|---|---|---|---|---|---|
| RP Strategic Income Plus Fund (Class F) | -0.56% | -0.22% | 3.74% | 5.12% | 5.12% | 2.42% | 3.03% | 3.76% |
| FTSE Canada All Corporate Bond Index | -0.14% | 1.03% | 5.75% | 6.97% | 6.97% | 1.47% | 2.31% | 2.98% |
Source: RPIA, FTSE Russell. Data as of 12/31/2024 and annualized for periods greater than one year. SI = 04/2016.
STIP gained -0.22% during the quarter, underperforming the FTSE Canada All Corporate Bond Index (the “Index”) as Canadian interest rates and credit spreads notably outperformed.
Positive returns from credit spread exposure were outweighed by negative returns associated with interest rate exposure, particularly US rates which rose (sold off) significantly into year-end. Credit returns were driven by positions in energy-infrastructure issuers, led by AltaGas, which realized significant spread compression after executing a tender offer in November. TMT-related issuers also provided strong returns, including positions in Charter, Warner Bros Discovery, and Rogers. Government agency and provincial exposures contributed to total returns during the quarter.
| Top Contributors to Credit Return (Sector) |
|---|
Energy-Infrastructure |
Telecom/Media |
| Consumers |
Source: RPIA. Data as of 12/31/2024.
| Top Contributors to Credit Return (Issuer) |
|---|
| Altagas Ltd. |
| Electricite De France SA |
| Charter Communications Inc. |
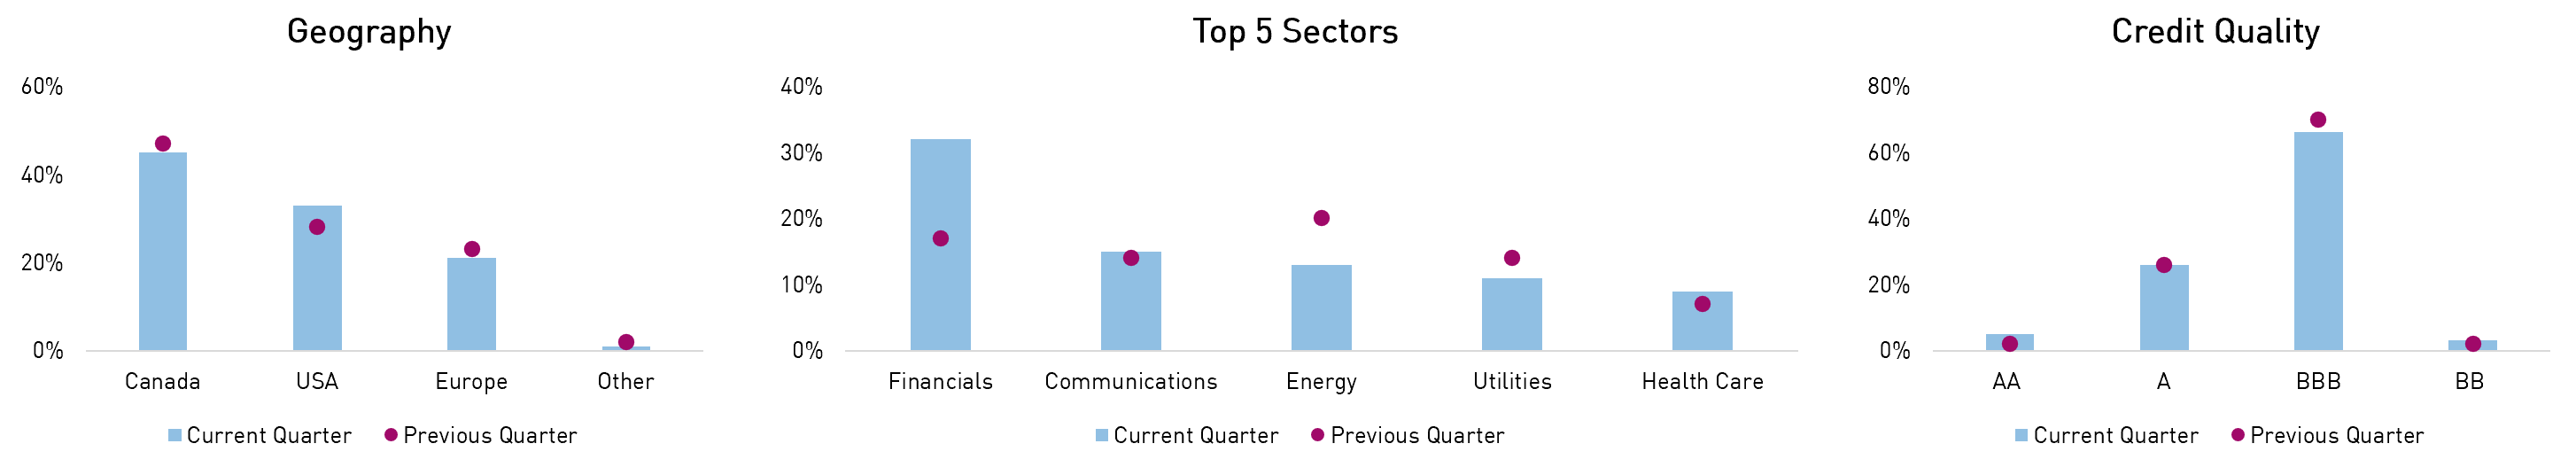
Headline risk exposures were actively managed during the period, while both interest rate and credit risk were reduced from their local highs into year-end. Geographically, the portfolio monetized well-performing domestic exposures in favour of adding to US issuers given a weaker Canadian economic backdrop and recent outperformance of Canadian spreads. Sector-wise, the portfolio trimmed consumer-related and energy-infrastructure exposures and rotated into high-quality financial issuers. Quality-wise, the portfolio moved up-in-quality, finishing the period with an A rating and minimal (3%) high yield exposure, which primarily consists of corporate hybrid securities of a issuers rated investment grade at the senior level. We believe the Fund can continue to actively source positive returns from both interest rate and credit spread exposure, underpinned by an attractive technical environment for credit.
| Q4 2024 | Q3 2024 | |
|---|---|---|
| Effective Duration (Years) | 4.6 | 4.1 |
| Credit Duration (Years) | 3.9 | 4.0 |
| Average Term (Years) | 10.0 | 10.0 |
| % Rated Investment Grade | 97% | 98% |
Source: RPIA. Data as of 12/31/2024.
Source: RPIA. Data as of 12/31/2024.
RP Alternative Global Bond Fund
| 1 MON | 3 MON | 6 MON | YTD | 1 YR | 3 YR | 5 YR | Since Inception | |
|---|---|---|---|---|---|---|---|---|
| RP Alternative Global Bond Fund (Class F) | 0.78% | 0.91% | 3.34% | 8.98% | 8.98% | 6.17% | 6.23% | 6.49% |
| FTSE Canada All Corporate Bond Index | -0.14% | 1.03% | 5.75% | 6.97% | 6.97% | 1.47% | 2.31% | 2.31% |
Source: RPIA, FTSE Russell. Data as of 12/31/2024 and annualized for periods greater than one year. SI = 07/2019.
AGB returned +0.91% during the quarter, modestly underperforming the FTSE Canada All Corporate Bond Index (the “Index”).
The Fund generated strong returns from credit spread exposure while active duration management limited the adverse impact of rising risk-free yields. Credit returns were led by significant spread compression in asset backed securities from Subway and Frontier, which are backed by franchise revenues and fiber assets, respectively. Other contributions were driven by BBB-rated US -US-domiciled issuers that outperformed during the Trump-driven rally and subordinated European bank debt. Although the Fund’s dynamic hedges were net detractors overall, we remain committed to embedding downside protection, given the expensive index-level credit spread and equity valuations.
| Top Contributors to Credit Return (Sector) |
|---|
| Financials |
| Telecom/Media |
| Energy-Infrastructure |
Source: RPIA. Data as of 12/31/2024.
| Top Contributors to Credit Return (Issuer) |
|---|
| Subway Funding LLC |
| Frontier Issuer LLC |
| Charter Communications Inc. |
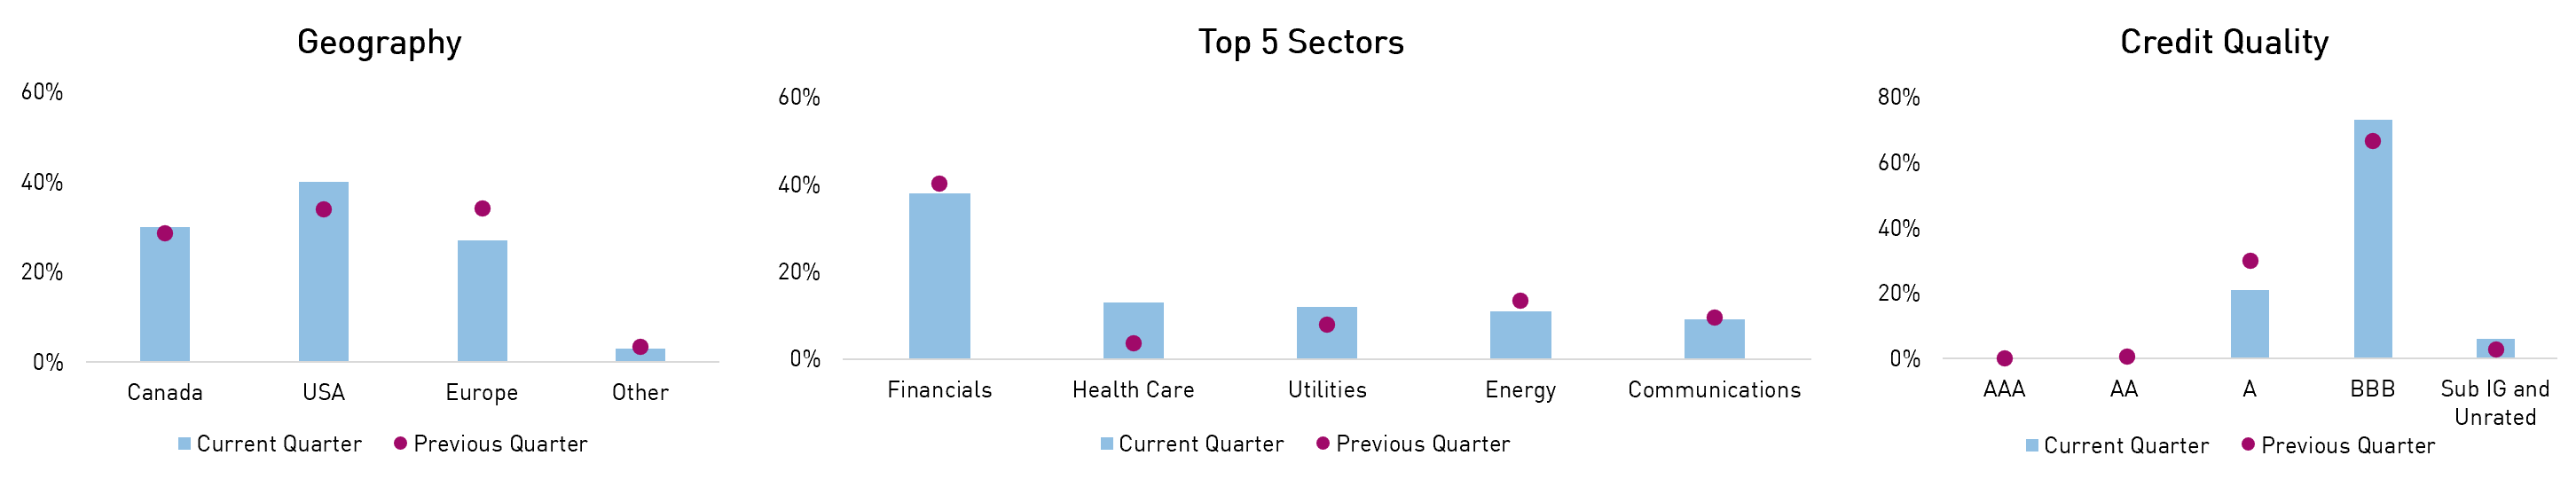
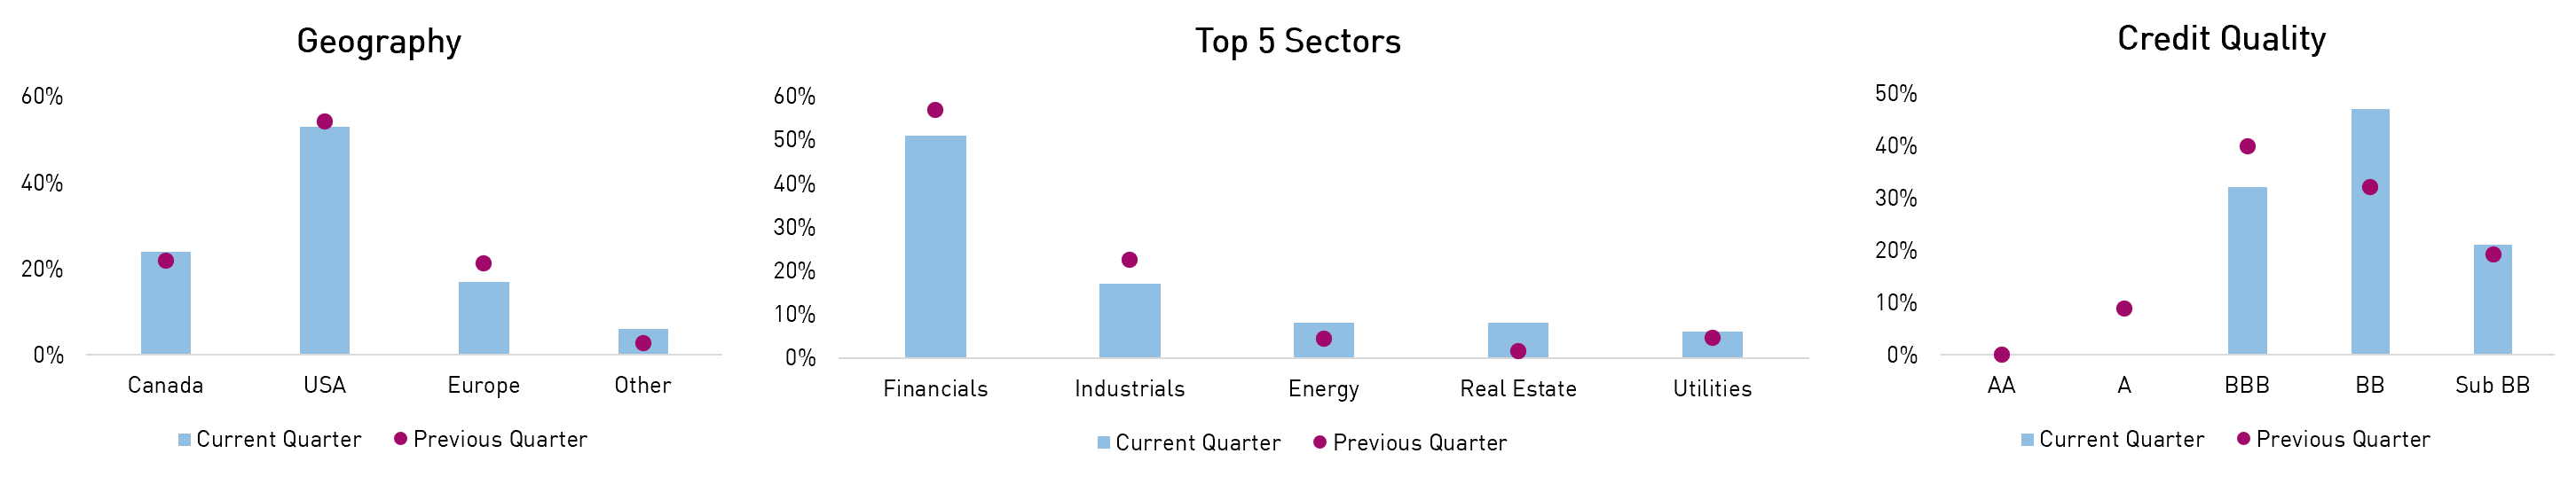
Interest rate exposure was actively managed between 1.0-4.3yrs of duration during the quarter, ultimately finishing at the low end of the range at year-end. Similarly, credit risk was increased prior to and during the Trump-driven rally before being reduced into year-end in anticipation of a heavy January supply calendar. Geographically, well-performing EUR-domiciled exposures were monetized and rotated into more attractive US-domiciled opportunities. Given the increase in hedges, the portfolio’s sector exposures mathematically increased, but as mentioned, the overall credit risk was reduced. In terms of credit quality, the portfolio added to select opportunities in the BBB and BB-rated segment of the market while maintaining a sizeable hedging portfolio. We believe the Fund is well positioned to continue navigating the constantly changing spread and rate markets to generate strong risk-adjusted returns, given its expanded toolkit and commonsense approach.
| Q4 2024 | Q3 2024 | |
|---|---|---|
| Effective Duration (Years) | 1.2 | 1.1 |
| Credit Duration (Years) | 2.3 | 2.5 |
| Average Term (Years) | 9.2 | 8.8 |
| Net Credit Leverage | 0.5x | 0.5x |
| % Rated Investment Grade | 92% | 110% |
Source: RPIA. Data as of 12/31/2024.
Source: RPIA. Data as of 12/31/2024.
RP Debt Opportunities
| 1 MON | 3 MON | 6 MON | YTD | 1 YR | 3 YR | 5 YR | 10 YR | Since Inception | |
|---|---|---|---|---|---|---|---|---|---|
| RP Debt Opportunities | 0.71% | 1.40% | 3.00% | 8.30% | 8.30% | 6.17% | 4.94% | 5.80% | 7.69% |
| FTSE Canada All Corporate Bond Index | -0.14% | 1.03% | 5.75% | 6.97% | 6.97% | 1.47% | 2.31% | 3.04% | 4.02% |
Source: RPIA, FTSE Russell. Data as of 12/31/2024 and annualized for periods greater than one year. SI = 10/2009. RP Debt Opportunities strategy performance presented above represents a composite return of RP Debt Opportunities Fund LP Class A and RP Debt Opportunities Fund Ltd. Class A, from October 2009 to July 2011 and RP Debt Opportunities Fund Ltd. Class A. from August 2011 onwards.
DOF returned +1.40% during the quarter, outperforming the FTSE Canada All Corporate Bond Index (the “Index”).
The Strategy’s outsized returns from credit spread exposure and the portfolio’s inherently lower duration led to outperformance relative to more traditional fixed income that suffered from the sell-off in interest rates. Credit returns were led by significant spread compression in select asset backed securities from multiple issuers. Other contributions were driven by BBB-rated US -US-domiciled issuers that outperformed during the Trump-driven rally and subordinated European bank debt. Although the Fund’s dynamic hedges were net detractors overall, we remain committed to embedding downside protection, given the expensive index-level credit spread and equity valuations.
| Top Contributors to Credit Return (Sector) |
|---|
| Financials |
| Telecom/Media |
| Energy-Infrastructure |
Source: RPIA. Data as of 12/31/2024.
| Top Contributors to Credit Return (Issuer) |
|---|
| Subway Funding LLC |
| Frontier Issuer LLC |
| Charter Communications Inc. |
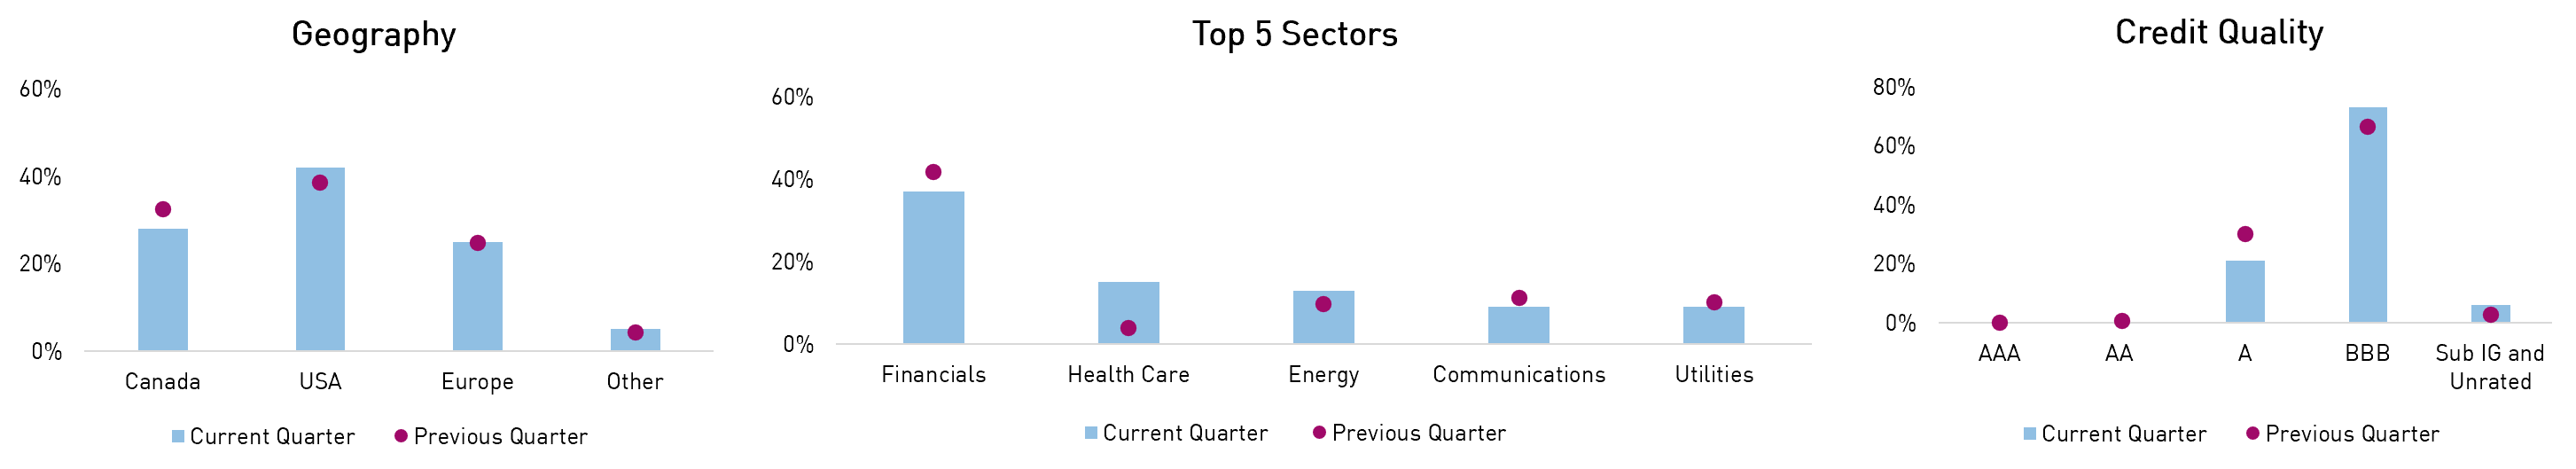
Interest rate exposure was increased early in the quarter but was reduced following Trump’s victory, which caused risk-free yields to spike higher. Credit risk was also actively managed, taking advantage of the rally in credit spreads before reducing risk into year-end. Geographically, the portfolio trimmed well-performing domestic credit risk and rotated into more attractive US exposures. Sector-wise, financial-related exposure was trimmed in anticipation of a busy new issuance calendar in January and rotated into relatively attractive opportunities in the healthcare sector. The Strategy modestly added to select opportunities in the BBB and BB-rated segment of the market. Still, the portfolio remains heavily skewed towards investment grade credit, especially when accounting for the portfolio’s dynamic hedges. We believe the Strategy is well positioned to continue to navigate ever-changing markets and generate strong risk-adjusted returns, given its expanded toolkit and commonsense approach.
| Q4 2024 | Q3 2024 | |
|---|---|---|
| Effective Duration (Years) | 0.8 | 0.7 |
| Credit Duration (Years) | 2.3 | 2.4 |
| Average Term (Years) | 8.1 | 8.4 |
| Net Credit Leverage | 0.6x | 0.5x |
| % Rated Investment Grade | 94% | 97% |
Source: RPIA. Data as of 12/31/2024.
Source: RPIA. Data as of 12/31/2024.
RP Select Opportunities
| 1 MON | 3 MON | 6 MON | YTD | 1 YR | 3 YR | 5 YR | 10 YR | Since Inception | |
|---|---|---|---|---|---|---|---|---|---|
| RP Select Opportunities Strategy | 0.45% | 1.17% | 4.24% | 11.09% | 11.09% | 8.00% | 8.98% | 8.74% | 8.37% |
| Bloomberg US High Yield (CAD Hedged) | -0.58% | -0.18% | 4.83% | 7.20% | 7.20% | 2.10% | 3.42% | 4.47% | 4.15% |
Source: RPIA, Bloomberg. Data as of 12/31/2024 and annualized for periods greater than one year. SI = 04/2014. RP Select Opportunities strategy performance presented above is a hypothetical illustration based on the weighted average composite return of a separately managed account utilizing a similar strategy from inception in April 2014 to May 2014, then linked to the returns of RP Select Opportunities Cayman Fund Ltd. – Class C Lead.
SOF returned +1.17% during the quarter, outperforming the Bloomberg US High Yield (CAD Hedged) Bond Index (the “Index”).
The Strategy produced another quarter of strong results by generating outsized returns from credit spread exposure. Credit returns were primarily driven by financial-related exposures, which were well-diversified between specialty financials like business development companies, diversified banks, and select consumer finance issuers. Top individual contributors during the period were asset backed securities from various issuers, highlighting the Strategy’s ability to uncover pockets of opportunity across the credit spectrum. Additionally, consumer-related issuers, including homebuilders, were notable contributors as the industry’s spreads rallied alongside more friendly financial conditions. Although the Fund’s dynamic hedges were net detractors overall, we remain committed to embedding downside protection, given the expensive index-level credit spread and equity valuations.
| Top Contributors to Credit Return (Sector) |
|---|
| Financials |
| Telecom/Media |
| Energy |
Source: RPIA. Data as of 12/31/2024.
| Top Contributors to Credit Return (Issuer) |
|---|
| Hotwire Funding LLC |
| Frontier Issuer LLC |
| Geo Group Inc./The |
Credit risk was reduced quarter-over-quarter as the investment team prepared for more attractive entry points. Geographically, the portfolio monetized outperforming Canadian and European credit risk and rotated into US-domiciled exposures. Sector-wise, while financials remain the portfolio’s largest exposure, the sector was trimmed into year-end in anticipation of a busy new issuance calendar in January. In terms of credit quality, the portfolio’s overweight to investment grade was trimmed quarter-over-quarter as opportunities arose in select high yield issuers. We believe the Strategy is well-positioned to continue providing investors with strong risk-adjusted returns as an effective alternative to traditional fixed income, equity, and private asset allocations.
| Q4 2024 | Q3 2024 | |
|---|---|---|
| Effective Duration (Years) | 4.6 | 3.1 |
| Credit Duration (Years) | 3.1 | 3.3 |
| Average Term (Years) | 5.3 | 5.4 |
| Net Credit Leverage | 1.2x | 1.3x |
| % Rated Investment Grade | 32% | 49% |
Source: RPIA. Data as of 12/31/2024.
Source: RPIA. Data as of 12/31/2024.