
Our Latest Market Updates
Certain of Uncertainty - Q1 2025 Notes from the Trading Desk
Credit Market Themes in 5 Charts - Q1 2025
RP Strategic Income Plus Fund
| 1 MON | 3 MON | 6 MON | YTD | 1 YR | 3 YR | 5 YR | Since Inception | |
|---|---|---|---|---|---|---|---|---|
| RP Strategic Income Plus Fund (Class F) | -0.21% | 1.74% | 1.51% | 1.74% | 6.65% | 4.14% | 5.32% | 3.85% |
| FTSE Canada All Corporate Bond Index | -0.05% | 1.81% | 2.86% | 1.81% | 8.84% | 4.38% | 3.19% | 3.12% |
Source: RPIA, FTSE Russell. Data as of 03/31/2025 and annualized for periods greater than one year. SI = 04/2016.
STIP gained +1.74% during the quarter, performing roughly in line with the FTSE Canada All Corporate Bond Index (the “Index”).
Positive returns from interest rate exposure outweighed the effect of weaker credit spreads. Credit returns were driven by positions in CVS Health Corp and Intel Corp, as the credit spreads of both issuers rallied, bucking the trend of wider credit spreads more broadly. Also of note was the portfolio’s participation in the massive $26bn new issue (the 8th largest ever) from Mars Inc., a very profitable trade post-issuance on strong demand. Government agency and provincial exposures contributed to total returns during the quarter.
| Top Contributors to Credit Return (Sector) |
|---|
Technology |
Provincials |
| Industrials |
Source: RPIA. Data as of 03/31/2025.
| Top Contributors to Credit Return (Issuer) |
|---|
| CVS Health Corp. |
| Intel Corp. |
| HSBC Holdings PLC |
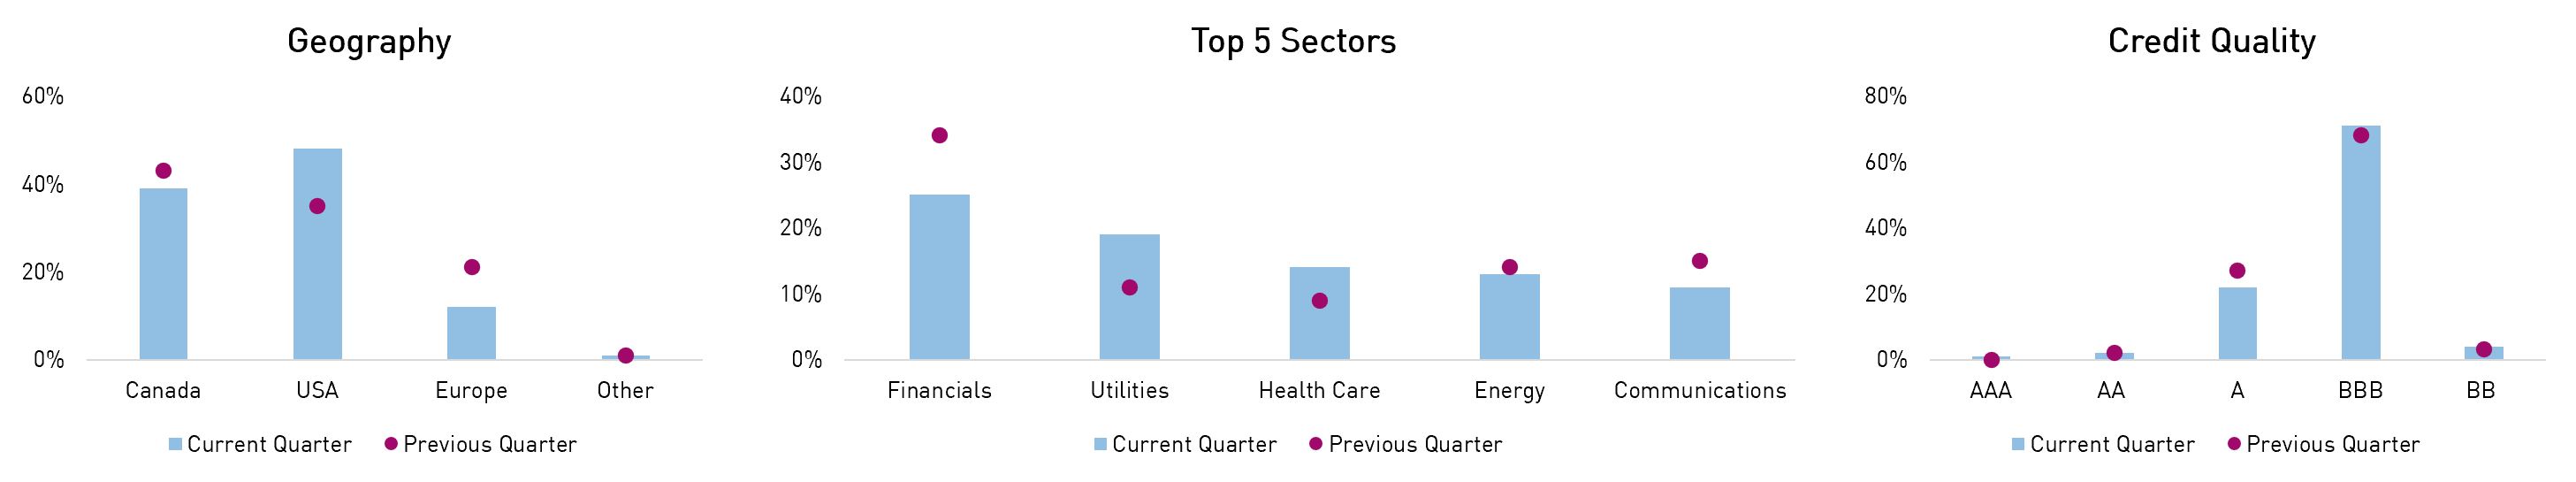
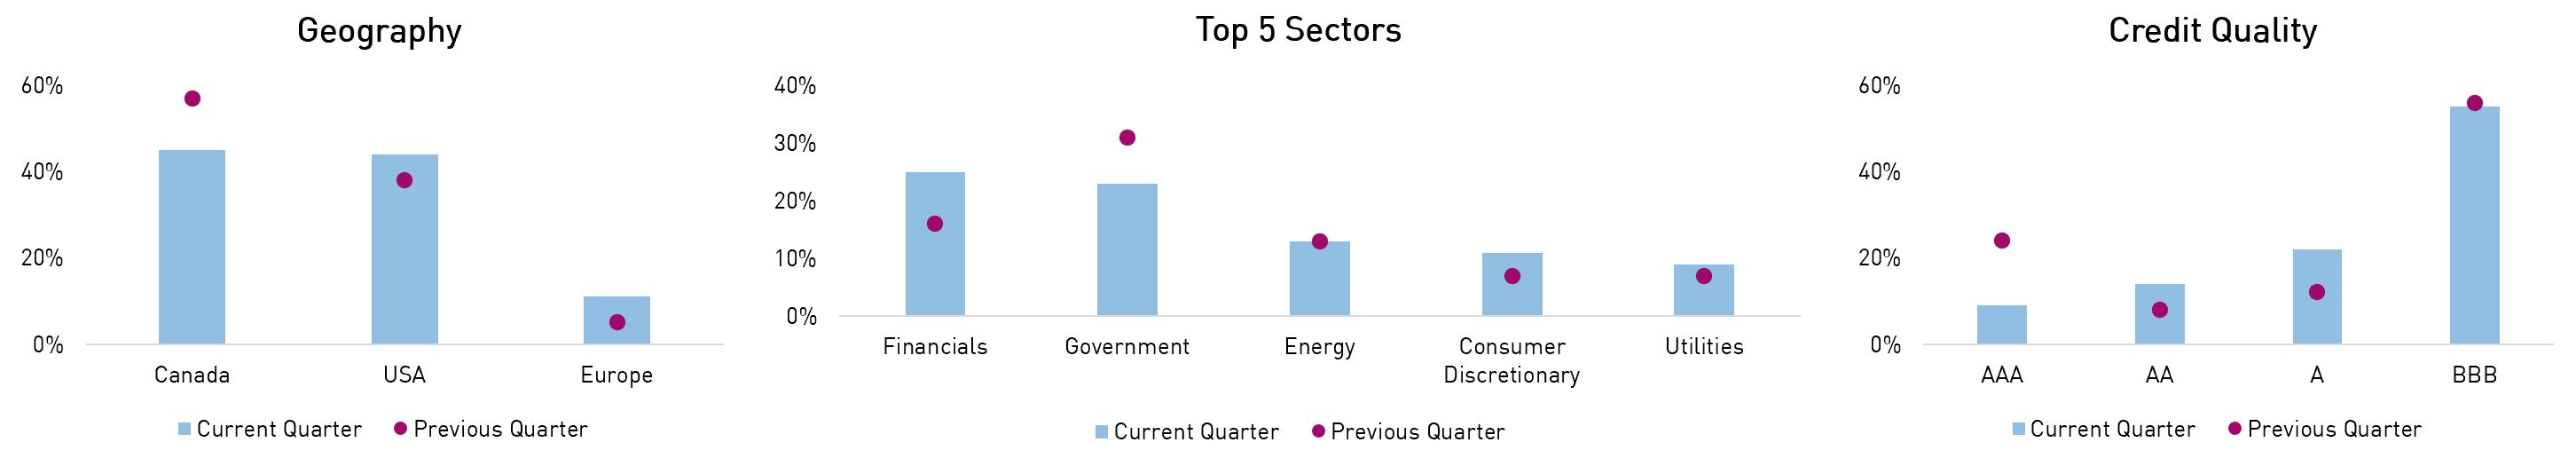
Headline risk exposures were actively managed during the period, with interest rate exposure and credit risk tactically ranging depending on valuations. Geographically, the portfolio monetized domestic and European exposures in favour of adding to more attractive US issuers. Sector-wise, the portfolio trimmed financial-related and telecom/media exposures to add to more defensive utility and healthcare issuers. Quality-wise, the portfolio maintained an average A rating and minimal (3%) high yield exposure, which primarily consists of corporate hybrid securities of issuers rated investment grade at the senior security level. We believe the Fund can continue to actively source positive returns from both interest rate and credit spread exposure, underpinned by an attractive technical environment for credit.
| Q1 2025 | Q4 2024 | |
|---|---|---|
| Effective Duration (Years) | 5.0 | 4.6 |
| Credit Duration (Years) | 5.0 | 3.9 |
| Average Term (Years) | 11.5 | 10.0 |
| % Rated Investment Grade | 96% | 97% |
Source: RPIA. Data as of 03/31/2025.
Source: RPIA. Data as of 03/31/2025.
RP Alternative Global Bond Fund
| 1 MON | 3 MON | 6 MON | YTD | 1 YR | 3 YR | 5 YR | Since Inception | |
|---|---|---|---|---|---|---|---|---|
| RP Alternative Global Bond Fund (Class F) | 0.76% | 2.13% | 3.06% | 2.13% | 7.55% | 7.56% | 10.44% | 6.59% |
| FTSE Canada All Corporate Bond Index | -0.05% | 1.81% | 2.86% | 1.81% | 8.84% | 4.38% | 3.19% | 2.53% |
Source: RPIA, FTSE Russell. Data as of 03/31/2025 and annualized for periods greater than one year. SI = 07/2019.
AGB returned +2.13% during the quarter, outperforming the FTSE Canada All Corporate Bond Index (the “Index”).
The Fund generated strong returns from credit spread exposure despite weaker credit spreads at the index level. Additionally, active duration management enabled the portfolio to participate in the upside associated with decreasing risk-free yields. Credit returns were led by European bank debt and select issuers across industries, including CVS Health Corp, Tennet Holding BV, and Intel Corp. The portfolio’s participation in the massive $26bn new issue (the 8th largest ever) from Mars Inc. was profitable as credit spreads tightened post-issuance on strong demand. Also of note were the Fund’s dynamic hedges, which mitigated downside volatility well and modulated the uncertainty that riddled markets.
| Top Contributors to Credit Return (Sector) |
|---|
| Hedges |
| Financials |
| Technology |
Source: RPIA. Data as of 03/31/2025.
| Top Contributors to Credit Return (Issuer) |
|---|
| SDPR S&P 500 ETF TRUST |
| CVS Health Corp. |
| Tennet Holdings BV |
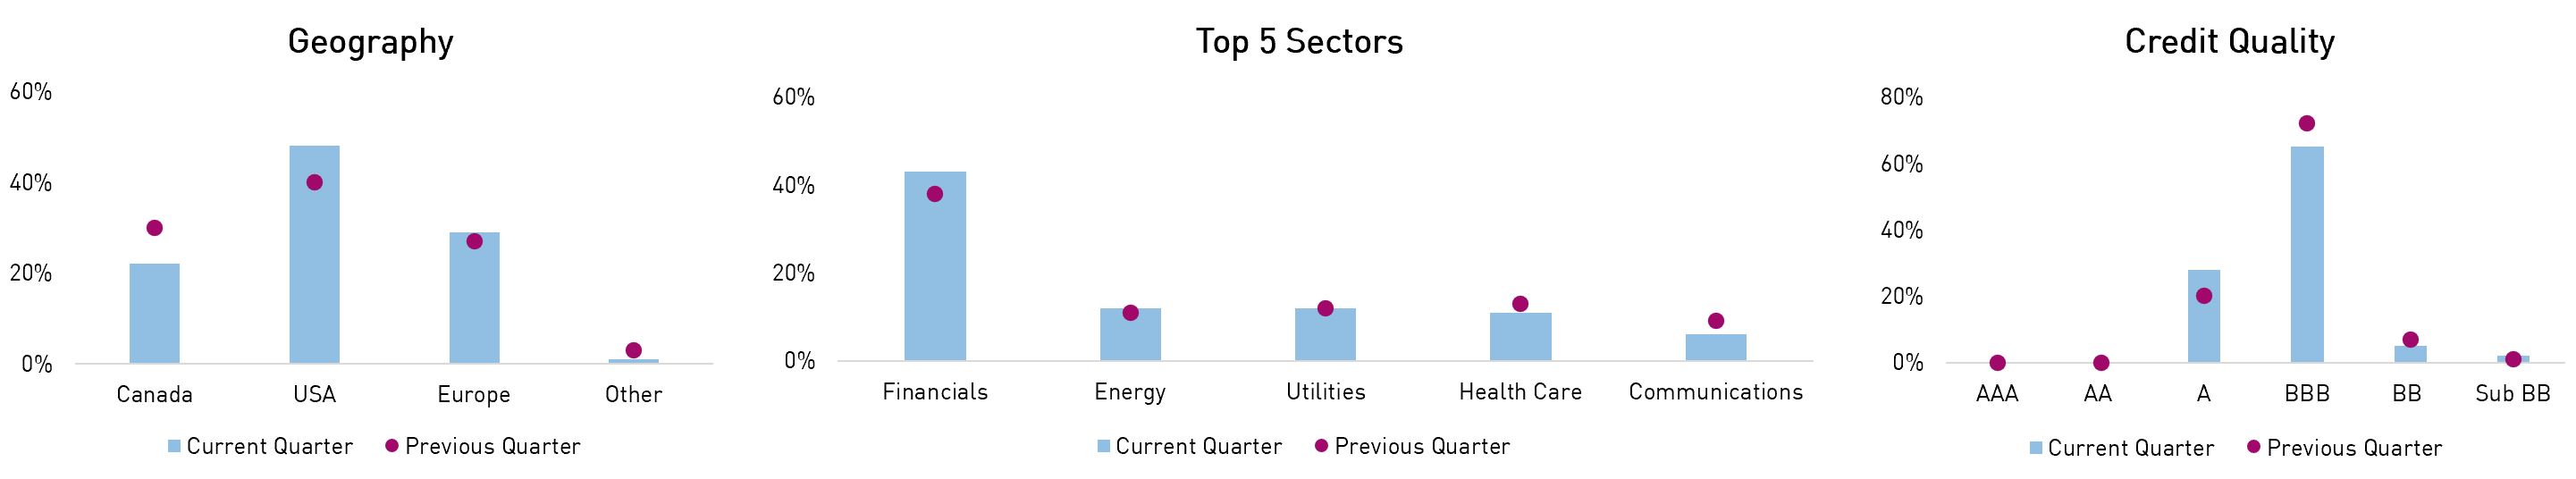
Interest rate exposure was actively managed between 0.2-3.9yrs of duration during the quarter as the portfolio successfully navigated the volatile interest rate environment. Similarly, credit risk was actively managed during the period, mainly increasing to take advantage of high-quality opportunities, including the Mars Inc. new issue. Geographically, domestic exposures were trimmed in favour of rotating into more attractive US-domiciled opportunities. Sector-wise, the portfolio modestly trimmed well-performing exposures across sectors and added to high-quality financials. In terms of credit quality, the portfolio reduced BBB rated holdings and moved up-in-quality to A rated issuers. We believe the Fund is well positioned to continue navigating the increasingly volatile market given its expanded toolkit and commonsense approach.
| Q1 2025 | Q4 2024 | |
|---|---|---|
| Effective Duration (Years) | 0.9 | 1.2 |
| Credit Duration (Years) | 5.6 | 2.3 |
| Average Term (Years) | 6.9 | 9.2 |
| Net Credit Leverage | 1.1x | 0.5x |
| % Rated Investment Grade | 93% | 92% |
Source: RPIA. Data as of 03/31/2025.
Source: RPIA. Data as of 03/31/2025.
RP Debt Opportunities
| 1 MON | 3 MON | 6 MON | YTD | 1 YR | 3 YR | 5 YR | 10 YR | Since Inception | |
|---|---|---|---|---|---|---|---|---|---|
| RP Debt Opportunities | 0.22% | 0.96% | 2.38% | 0.96% | 5.88% | 7.26% | 10.64% | 5.67% | 7.63% |
| FTSE Canada All Corporate Bond Index | -0.05% | 1.81% | 2.86% | 1.81% | 8.84% | 4.38% | 3.19% | 2.86% | 4.07% |
Source: RPIA, FTSE Russell. Data as of 03/31/2025 and annualized for periods greater than one year. SI = 10/2009. RP Debt Opportunities strategy performance presented above represents a composite return of RP Debt Opportunities Fund LP Class A and RP Debt Opportunities Fund Ltd. Class A, from October 2009 to July 2011 and RP Debt Opportunities Fund Ltd. Class A. from August 2011 onwards.
DOF returned +0.96% during the quarter, underperforming the FTSE Canada All Corporate Bond Index (the “Index”).
The Strategy generated outsized returns from credit spread exposure despite weaker spreads at the index level. The portfolio’s inherently lower duration led to underperformance relative to more traditional fixed income that benefitted from the rally in interest rates. Nonetheless, the Strategy successfully posted its 11th consecutive quarter of positive absolute returns during a remarkably volatile period. Credit returns were led by European bank debt and select issuers across industries, including CVS Health Corp, Tennet Holding BV, and Intel Corp. The portfolio’s participation in the massive $26bn new issue (the 8th largest ever) from Mars Inc. was profitable as credit spreads tightened post-issuance on strong demand. Also of note were the Strategy’s dynamic hedges, which mitigated downside volatility extremely well and modulated the uncertainty that riddled markets.
| Top Contributors to Credit Return (Sector) |
|---|
| Hedges |
| Financials |
| Technology |
Source: RPIA. Data as of 03/31/2025.
| Top Contributors to Credit Return (Issuer) |
|---|
| SPDR S&P 500 ETF TRUST |
| CVS Health Corp. |
| BPCE SA |
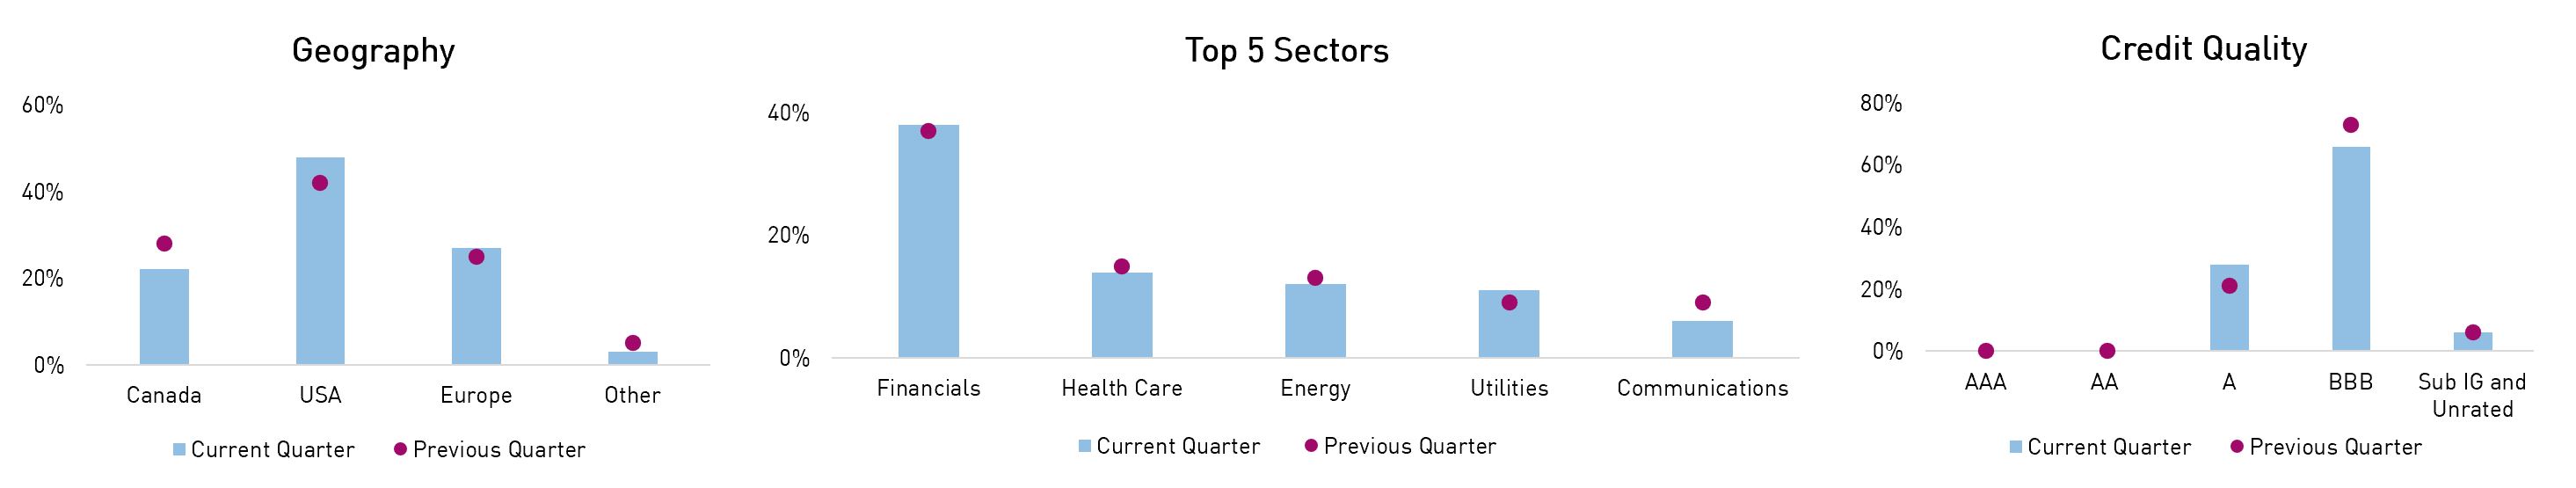
Interest rate exposure remained muted during the period, while credit risk was actively managed depending on valuations and the opportunity set. Credit exposure increased near the end of the quarter, but it was concentrated in high-quality investment grade issuers, including attractively priced new issues like the Mars Inc. deal. Geographically, the portfolio trimmed well-performing domestic credit risk and rotated into more attractive US exposures. Sector-wise, higher-beta sectors and cyclical sectors were trimmed in favour of consumer staples and utilities. The Strategy moved up-in-quality by reducing BBB rated credit and rotating into A rated exposures. The portfolio remains heavily skewed towards investment grade credit, especially when accounting for the portfolio’s dynamic hedges. We believe the Strategy is well positioned to continue to navigate ever-changing markets and generate strong risk-adjusted returns, given its expanded toolkit and commonsense approach.
| Q1 2025 | Q4 2024 | |
|---|---|---|
| Effective Duration (Years) | 0.7 | 0.8 |
| Credit Duration (Years) | 5.8 | 2.3 |
| Average Term (Years) | 7.0 | 8.1 |
| Net Credit Leverage | 1.2x | 0.6x |
| % Rated Investment Grade | 94% | 94% |
Source: RPIA. Data as of 03/31/2025.
Source: RPIA. Data as of 03/31/2025.
RP Select Opportunities
| 1 MON | 3 MON | 6 MON | YTD | 1 YR | 3 YR | 5 YR | 10 YR | Since Inception | |
|---|---|---|---|---|---|---|---|---|---|
| RP Select Opportunities Strategy | -1.23% | -0.18% | 0.99% | -0.18% | 6.04% | 9.11% | 16.97% | 8.36% | 8.15% |
| Bloomberg US High Yield (CAD Hedged) | -1.15% | 0.65% | 0.47% | 0.65% | 6.47% | 4.03% | 6.59% | 4.26% | 4.12% |
Source: RPIA, Bloomberg. Data as of 03/31/2025 and annualized for periods greater than one year. SI = 04/2014. RP Select Opportunities strategy performance presented above is a hypothetical illustration based on the weighted average composite return of a separately managed account utilizing a similar strategy from inception in April 2014 to May 2014, then linked to the returns of RP Select Opportunities Cayman Fund Ltd. – Class C Lead.
SOF returned -0.18% during the quarter, underperforming the Bloomberg US High Yield (CAD Hedged) Bond Index (the “Index”).
The portfolio’s focus on the higher-quality segment of the high yield market and the utilization of dynamic hedges enabled the Strategy to finish roughly despite high yield spreads widening +60 basis points during the period. Credit returns were primarily driven by financial-related exposures, which were well-diversified between specialty financials, diversified banks, and select consumer finance issuers. Top individual contributors during the period were real estate issuers like Services Properties Trust and subordinated debt across corporate non-financial and financial sectors. As mentioned, the portfolio’s commitment to embedding downside protection via dynamic hedges like options on equity indices, outright single-name shorts on vulnerable issuers, and the short side of pair trades, proved extremely beneficial as risk premia sold off.
| Top Contributors to Credit Return (Sector) |
|---|
| Financials |
| Real Estate |
| Hedges |
Source: RPIA. Data as of 03/31/2025.
| Top Contributors to Credit Return (Issuer) |
|---|
| Service Properties Trust |
| Macy's Inc. |
| CDX.NA.HY |
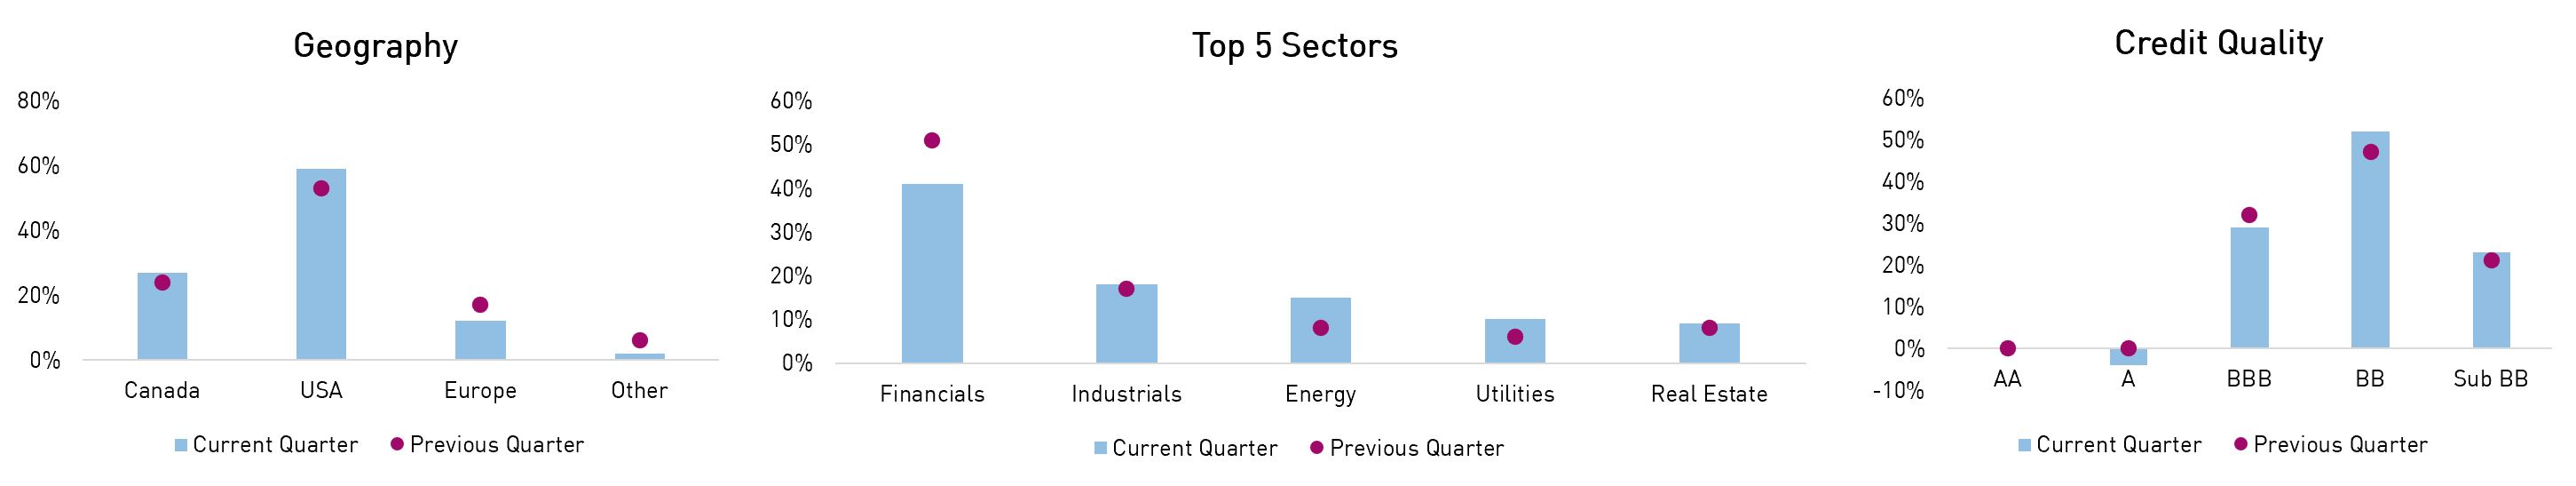
Credit risk was modestly increased quarter-over-quarter as the investment team added to what we view as attractively priced opportunities. Geographically, the portfolio monetized well-performing non-North American credit risk and rotated into US-domiciled exposures. Sector-wise, well-performing subordinated bank capital was monetized and rotated into more defensive utility and energy-infrastructure issuers. Credit quality was relatively unchanged quarter-over-quarter. We believe the portfolio is well-positioned to take advantage of compelling opportunities emerging due to recent volatility. In the meantime, we aim to continue providing investors with an effective alternative to traditional fixed income, equity, and private asset allocations.
| Q1 2025 | Q4 2024 | |
|---|---|---|
| Effective Duration (Years) | 3.5 | 4.6 |
| Credit Duration (Years) | 3.6 | 3.1 |
| Average Term (Years) | 4.7 | 5.3 |
| Net Credit Leverage | 1.2x | 1.2x |
| % Rated Investment Grade | 25% | 32% |
Source: RPIA. Data as of 03/31/2025.
Source: RPIA. Data as of 03/31/2025.
RP Fixed Income Plus
| 1 MON | 3 MON | 6 MON | YTD | 1 YR | 3 YR | 5 YR | 10 YR | Since Inception | |
|---|---|---|---|---|---|---|---|---|---|
| RP Fixed Income Plus | 0.29% | 1.49% | 1.81% | 1.49% | 6.35% | 4.19% | 3.10% | 2.41% | 3.63% |
| FTSE Canada Universe Short-Term Bond Index | 0.34% | 1.69% | 2.35% | 1.69% | 7.14% | 3.74% | 2.10% | 1.91% | 2.31% |
| Added Value | -0.05% | -0.20% | -0.54% | -0.20% | -0.79% | 0.46% | 1.00% | 0.50% | 1.32% |
Source: RPIA. FTSE Russell. Data as of 03/31/2025 and annualized for periods greater than one year. SI = 07/2010. RP Fixed Income Plus strategy performance presented above represents a weighted-average composite return of separately managed accounts utilizing a similar strategy from inception in July 2010 to April 2013 and linked to the returns of the RP Fixed Income Plus Fund, Series A thereafter.
FIP returned +1.49% during the quarter, modestly underperforming the FTSE Canada Universe Short-Term Bond Index (the “Index”).
The Strategy saw positive returns from interest rate exposure, while weaker credit spreads acted as a modest drag on returns. Federal and agency bonds were strong contributors to total returns as risk-free rates rallied. Credit returns were driven by high-quality Enbridge commercial paper and solid performance in Boeing and US telecom/media issuers like Charter Communications and Warner Bros Discovery.
| Top Contributors to Credit Return (Sector) |
|---|
| Industrials |
| Telecoms |
| Media |
Source: RPIA. Data as of 03/31/2025.
| Top Contributors to Credit Return (Issuer) |
|---|
Boeing Co/The |
| Charter Communications Inc. |
| BNP Paribas SA |
Headline portfolio metrics were relatively unchanged quarter-over-quarter. From a geographic perspective, the portfolio continued to monetize domestic exposure and rotate into more attractive US and European opportunities. Sector-wise, government-related exposures were trimmed in favour of adding to opportunities in the financial sector. The portfolio’s AAA rated exposures decreased as government-related exposures were trimmed, but corporate bond additions were mainly concentrated in the high-quality AA and A rated segment of the market. We believe the Strategy continues to offer investors a high-quality value proposition, given its +20% government bond exposure and healthy yield of 4.0%, more than +100bps greater than the Index’s yield.
| Q1 2025 | Q4 2024 | |
|---|---|---|
| Effective Duration (Years) | 2.5 | 2.7 |
| Credit Duration (Years) | 2.1 | 1.9 |
| Average Term (Years) | 2.8 | 3.0 |
| % Rated Investment Grade | 100% | 100% |
Source: RPIA. Data as of 03/31/2025.
Source: RPIA. Data as of 03/31/2025.